
|
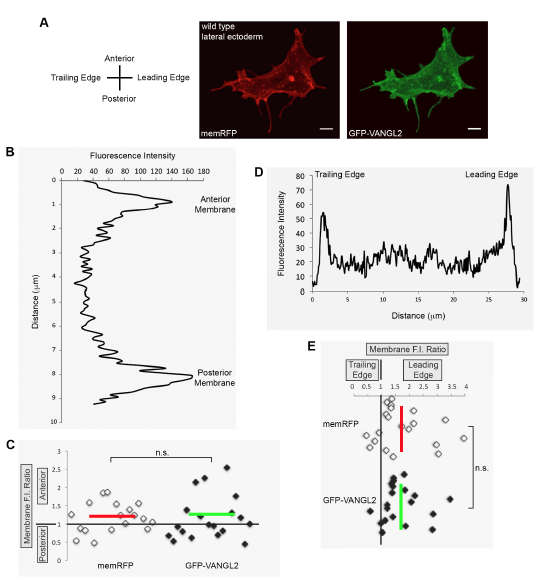
Fig. S4
Vangl2 expression in polarized migrating gastrula cells. (A) Tailbud-1-somite stage wild-type lateral ectodermal cells injected with memRFP and GFP-VANGL2 synthetic mRNA. (B,D) Plot profiles of fluorescence intensity (F.I.) across the anterior/posterior (B) and leading edge/trailing edge (D) axes of single ectodermal cells. (C,E) memRFP and GFPVANGL2 anterior/posterior (C) and leading edge/trailing edge (E) membrane F.I. ratios for individual lateral ectodermal cells (anterior/posterior n=18 cells, 15 embryos; leading edge/trailing edge n=20 cells, 15 embryos). Horizontal and vertical red and green lines indicate averages. n.s. not significant; two-tailed paired t-test. Scale bars, 5 μm.