
|
Fig. S3
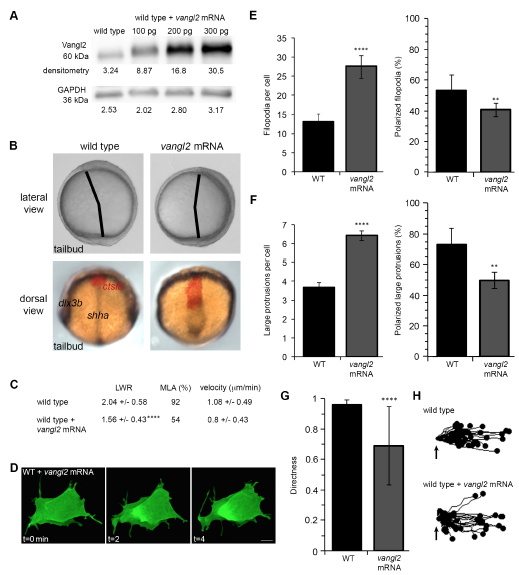
Vangl2 overexpression disrupts PCP and membrane protrusion dynamics. (A) Western blot of Vangl2 protein expression in vangl2 mRNA-injected wild-type (WT) embryos. Raw unmodified densitometry values are shown. (B) Upper panels, live images of late yolk-plug closure/tailbud stage embryos. Black lines denote the polster-tailbud angle. Lower panels, whole-mount in situ hybridizations performed using antisense RNA probes labeling the neural/non-neural ectoderm boundary (dlx3b), midline (shha), and prechordal mesendoderm (ctslb). (C) PCP and migration velocity quantitation in the ectoderm. LWR and MLA values were obtained from: wild type n values are as in Fig. 2; vangl2-injected wild type n=50 cells, 9 embryos. (D) Representative ectodermal cell expressing memGFP over three time points from time-lapse data. (E,F) Quantitation of the average total number of protrusions and the total percentage of polarized protrusions in wild type (n values are as in Figs 2 and 3) and vangl2-injected wild-type embryos (n=10 cells, 7 embryos). (G) Directed migration values (wild type n values are as in Fig. 3; vangl2-injected n=43 cells, 9 embryos). (H) Schematic representations of the migration paths of individual ectodermal cells. Origins (arrows) standardized for comparison. Dorsal is to the right. Average values are shown ± standard deviation. **P<0.01, ****P<0.0001; P values are versus wild type; two-tailed unpaired t-test. Scale bar, 5 μm.