
|
Fig. 5
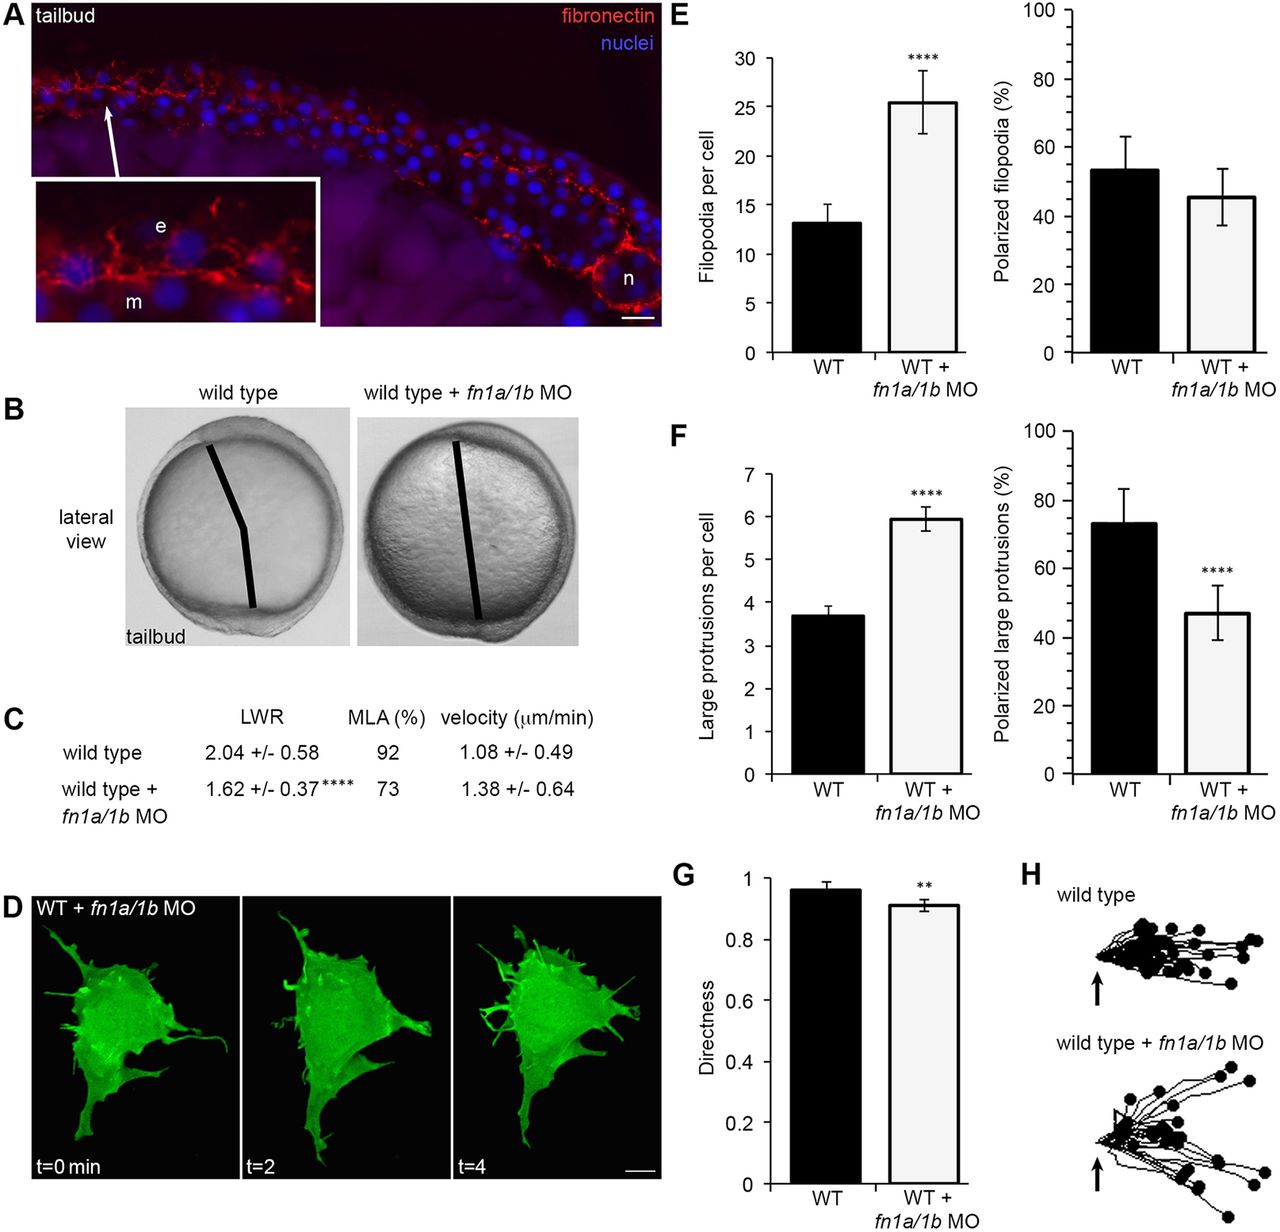
Fibronectin regulates membrane protrusion dynamics. (A) Cryosection through the dorsolateral region of a wild-type (WT) tailbud-stage embryo showing fibronectin and nuclei. Inset shows an enlarged image illustrating the relationship between ECM, ectodermal (e) and mesodermal (m) cells. n, notochord. (B) Live embryo images at late yolk-plug closure/tailbud stage in WT and fn1a/1b morpholino (MO)-injected WT embryos. Black lines denote the polster-tailbud angle. (C) PCP and migration velocity quantitation of ectodermal cells. LWR and MLA values were obtained from: WT, n=50 cells, 13 embryos; fn1a/1b MO-injected WT, n=48 cells, 10 embryos. (D) Representative ectodermal cell expressing memGFP over three time points from time-lapse data. (E,F) Quantitation of the average total number (left) and the total percentage of polarized (right) filopodia (E) and large protrusions (F) in WT (n=12 cells, 8 embryos) and fn1a/1b morphant (n=10 cells, 7 embryos) embryos. (G) Directed migration values in WT (n=50 cells, 11 embryos) and fn1a/1b morphants (n=32 cells, 10 embryos). (H) Schematic of the migration paths of individual ectodermal cells. Origins (arrows) standardized for comparison. Dorsal is to the right. Data are mean±s.d. **P<0.01, ****P<0.0001; P values are versus WT; two-tailed unpaired t-test. Scale bars: 20 µm in A; 5 µm in D.