
|
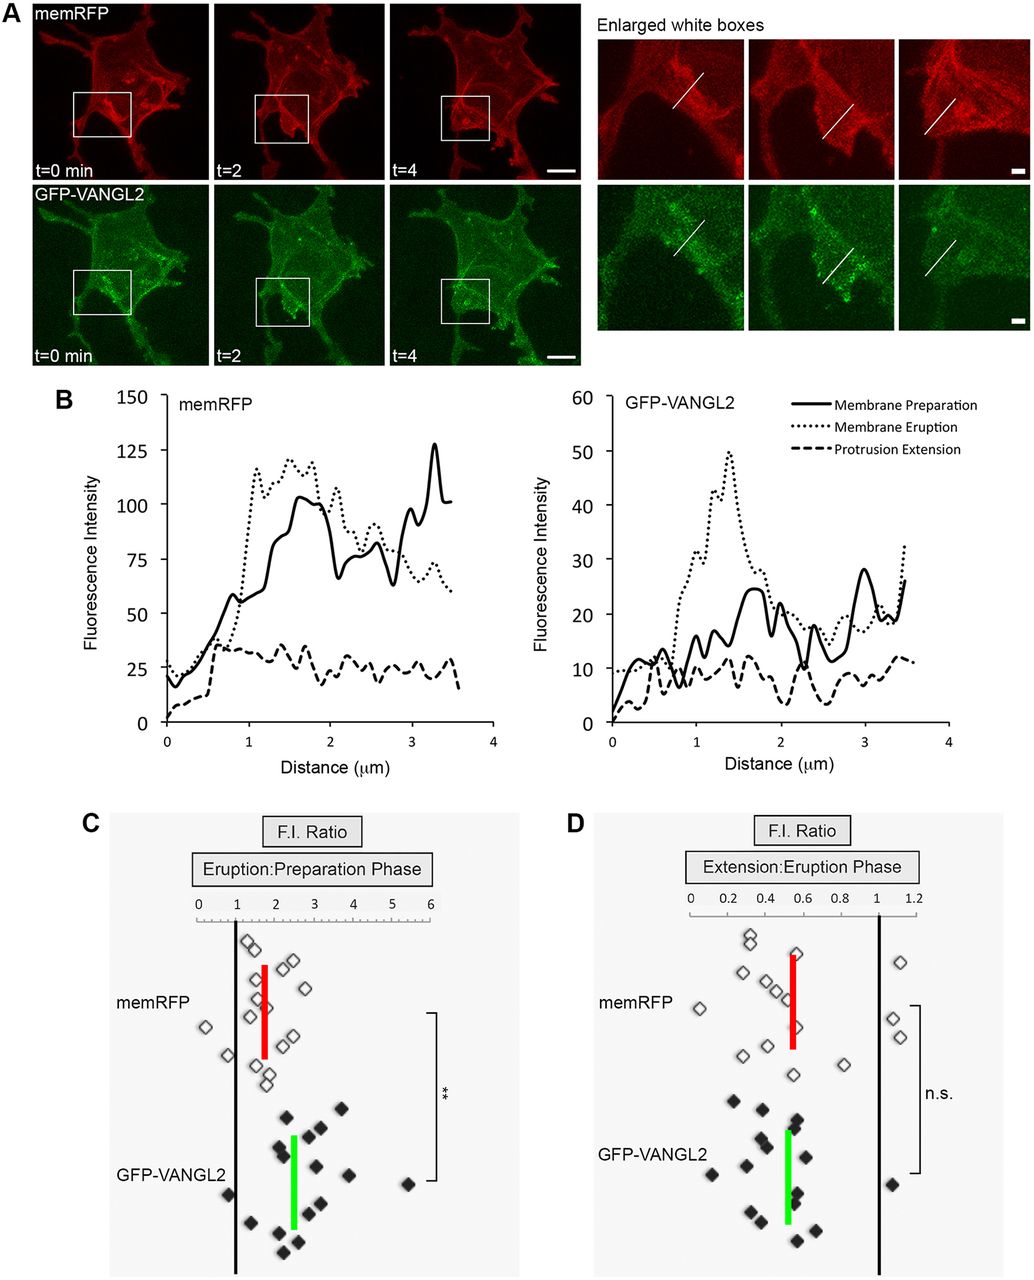
Fig. 4
Increased Vangl2 expression in forming membrane protrusions. (A) Time-lapse confocal images of wild-type lateral ectodermal cells expressing memRFP and GFP-VANGL2 (three time points shown). White boxes highlight a forming large protrusion (enlarged images on the right; white lines approximate the regions analyzed). (B) Plot profiles of fluorescence intensity (F.I.) across the plasma membrane of an individual large protrusion expressing memRFP (left) and GFP-VANGL2 (right) before protrusion formation (preparation), after formation (eruption) and during extension. (C,D) memRFP and GFP-VANGL2 F.I. ratios for individual large protrusions [eruption phase/preparation phase (C), n=16 protrusions, 6 embryos; extension phase/eruption phase (D), n=16 protrusions, 6 embryos]. Vertical red and green lines indicate the averages. **P<0.01; two-tailed paired t-test. n.s., not significant. Scale bars: 5 µm in A, left; 1 µm in A, right.