
|
Fig. 2
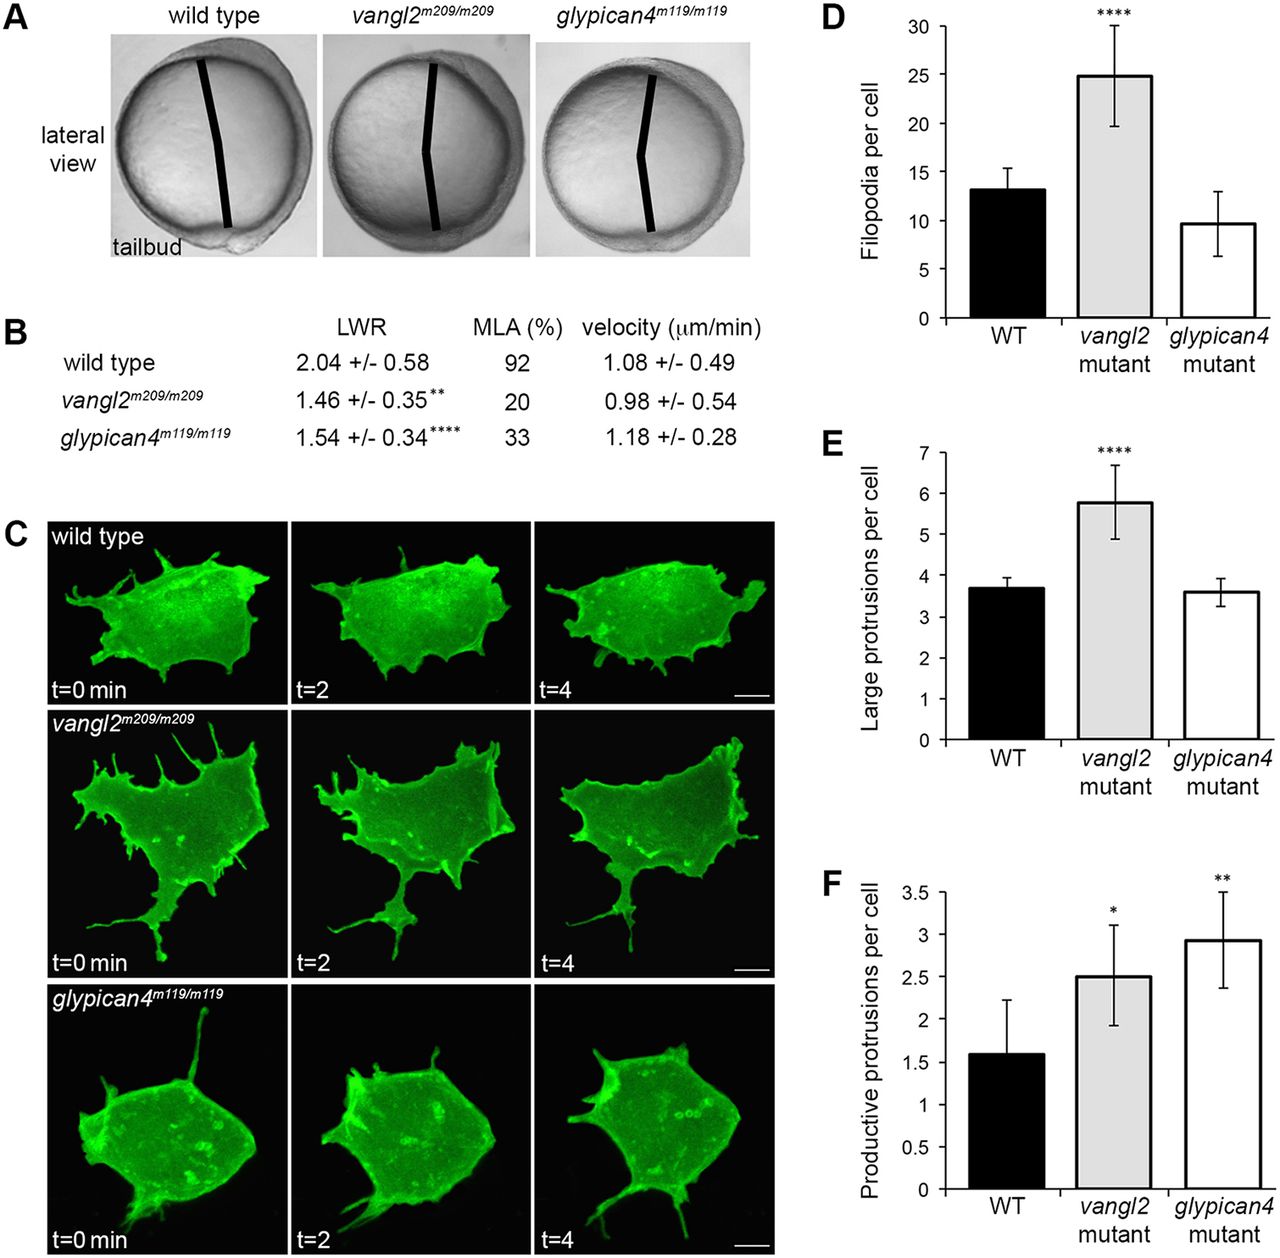
Membrane protrusion formation in vangl2 and glypican4 mutant embryos. (A) Live embryo images at late yolk-plug closure/tailbud stage. Black lines denote the polster-tailbud angle. (B) PCP and migration velocity quantitation in the ectoderm. LWR and MLA values were obtained from: wild type (WT), n=50 cells, 13 embryos; vangl2m209/m209, n=10 cells, 8 embryos; glypican4m119/m119, n=49 cells, 5 embryos. PCP data for vangl2 mutant ectoderm was previously published (Jessen et al., 2002), which explains the lower n. (C) Time-lapse confocal images of ectodermal cells expressing memGFP over three time points. (D-F) Quantitation of the total numbers of filopodia (D), large protrusions (E) and productive protrusions (F) formed by WT (n=12 cells, 8 embryos), vangl2m209/m209 (n=10 cells, 7 embryos) and glypican4m119/m119 (n=12 cells, 5 embryos). Data are mean±s.d. *P<0.05, **P<0.01, ****P<0.0001; P values are versus WT; one-way ANOVA significance test followed by Tukey HSD post-hoc tests. Scale bars: 5 µm.