
Image
|
Figure Caption
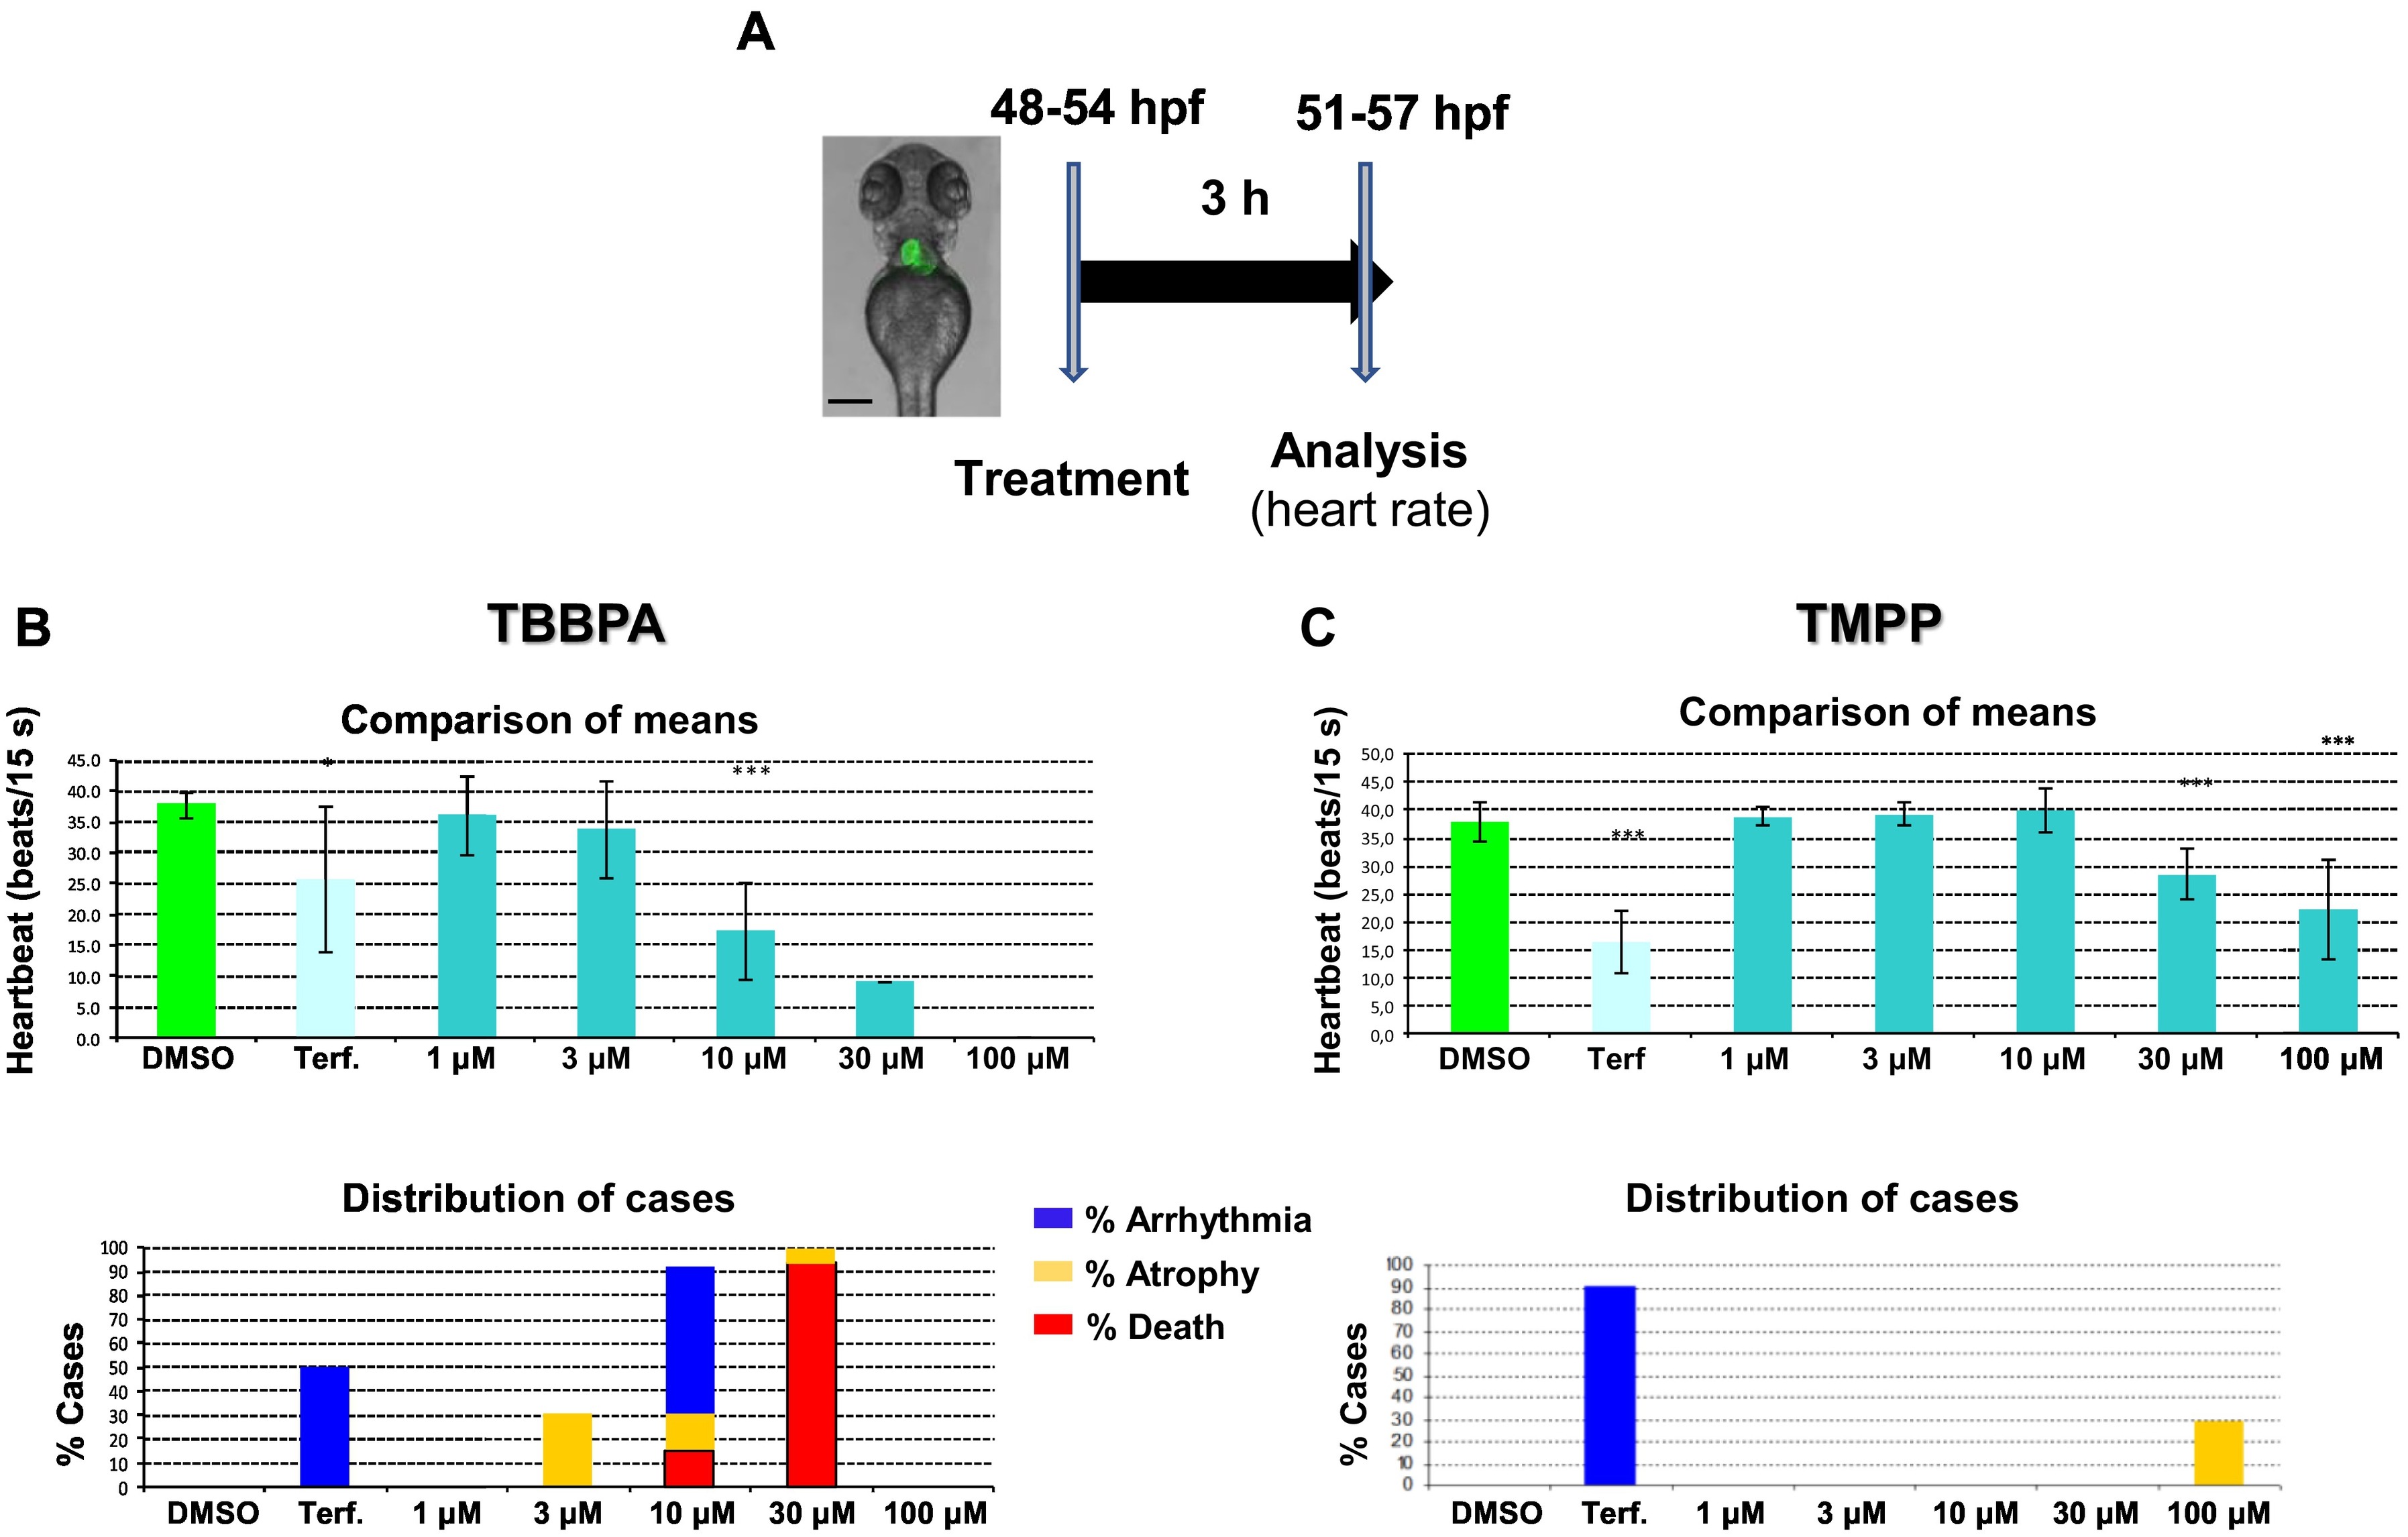
Fig. 3
Examples of cardiotoxicity results obtained for the BFR TBBPA and the OPFR TMPP (Experiment 1). (A) Schematic depicting a summary of the experimental design. B, C Upper graphs show the mean ± S.D. of the heartbeat rate obtained for TBBPA (B) and TMPP(C) (⁎⁎⁎p < 0.001, Mann-Whiteney U test). In the lower graphs, bars represent the percentage of embryos with altered heartbeat rhythmicity, atrophy, or death. Terf.: 5 μM Terfenadine. Scale bar represents 200 μM.
Acknowledgments
This image is the copyrighted work of the attributed author or publisher, and
ZFIN has permission only to display this image to its users.
Additional permissions should be obtained from the applicable author or publisher of the image.
Full text @ Neurotoxicol. Teratol.