
|
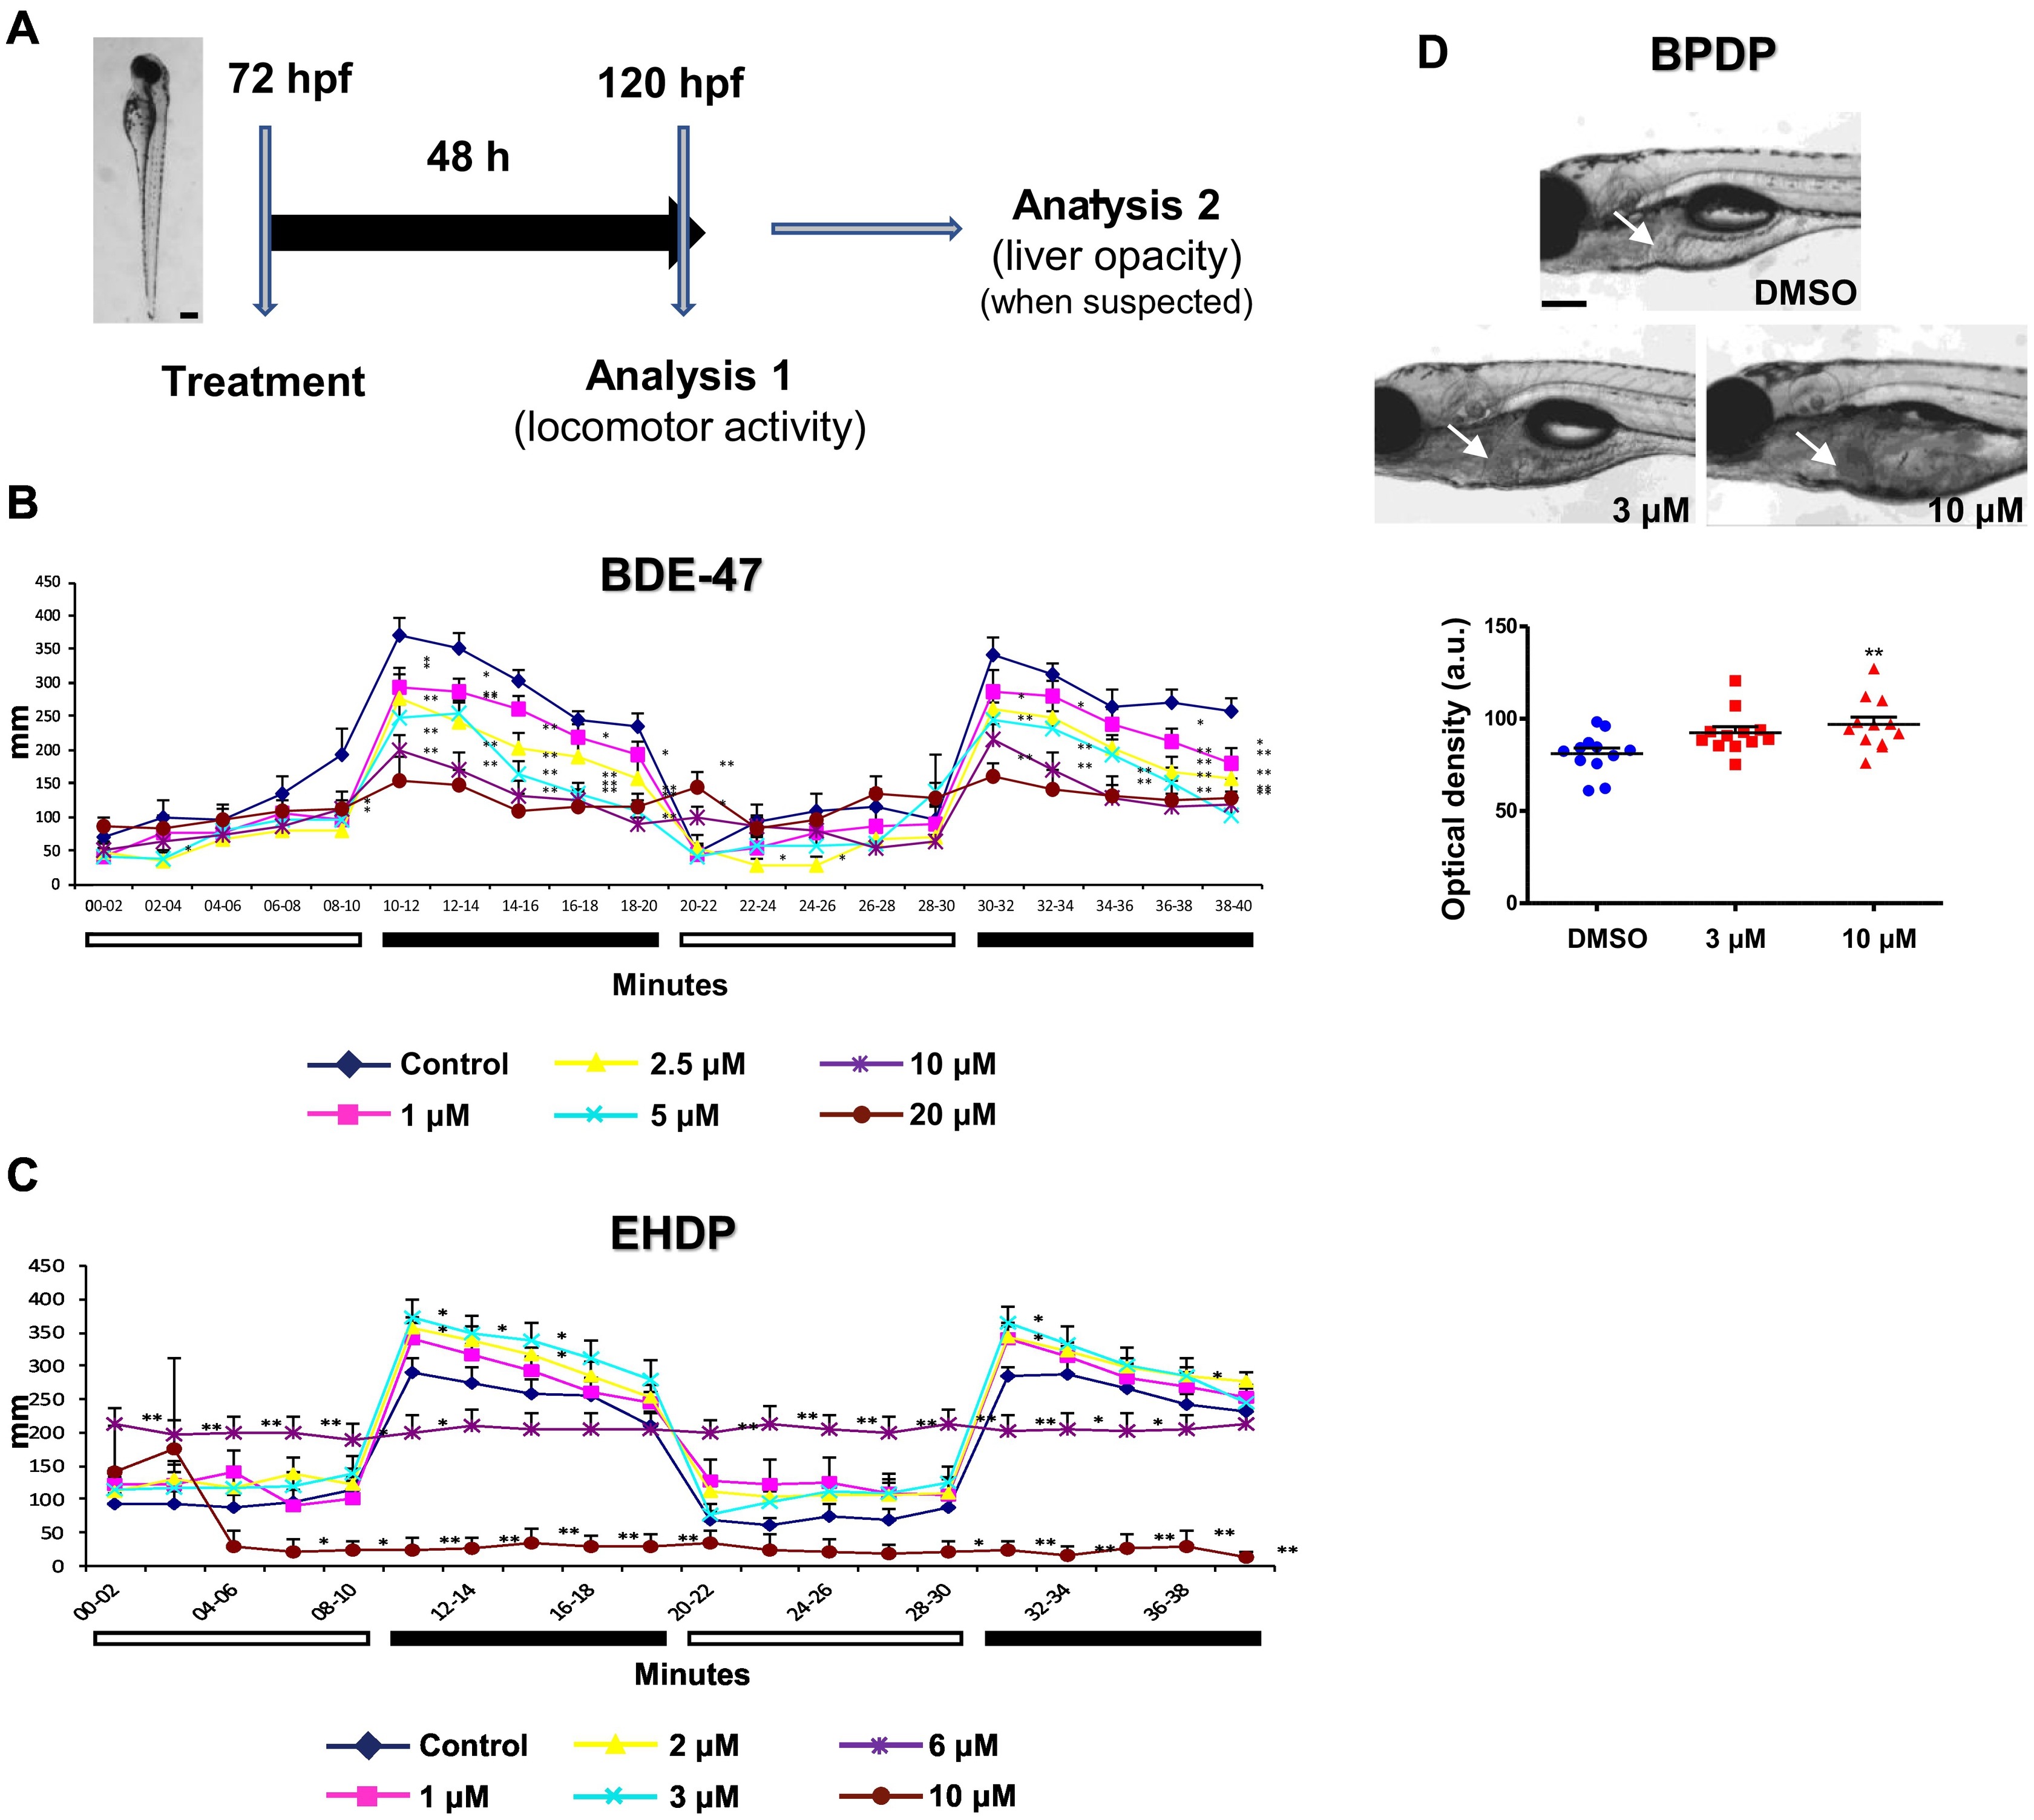
Fig. 2
Behavior alteration and hepatotoxicity assay and examples of the results obtained for the phased-out BDE-47 and the replacement EHDP in the behavior assay and for the OPFR BPDP in the hepatotoxicity assay (Experiment 1). A) Schematic depicting a summary of the experimental design for both assays. B, C) Behavior profile of 5 dpf larvae treated with BDE-47. (B) and EHDP (C). Graphs represent the mean of the distance moved by embryos treated with each chemical in 2 min' time bins (*p < 0.05; **p < 0.01, unpaired Student's t-test). White and black rectangles indicate the periods of light and dark respectively. (D) Representative bright field pictures of embryos untreated and treated with BPDP at the indicated concentrations. Arrows point to the position of the liver. Mean ± SEM of the liver optical density from 12 embryos per experimental group is represented in the graph. (⁎⁎p < 0.01, one-way ANOVA and Dunnett's post-test). Scale bar for all pictures represents 200 μM.