
Image
|
Figure Caption
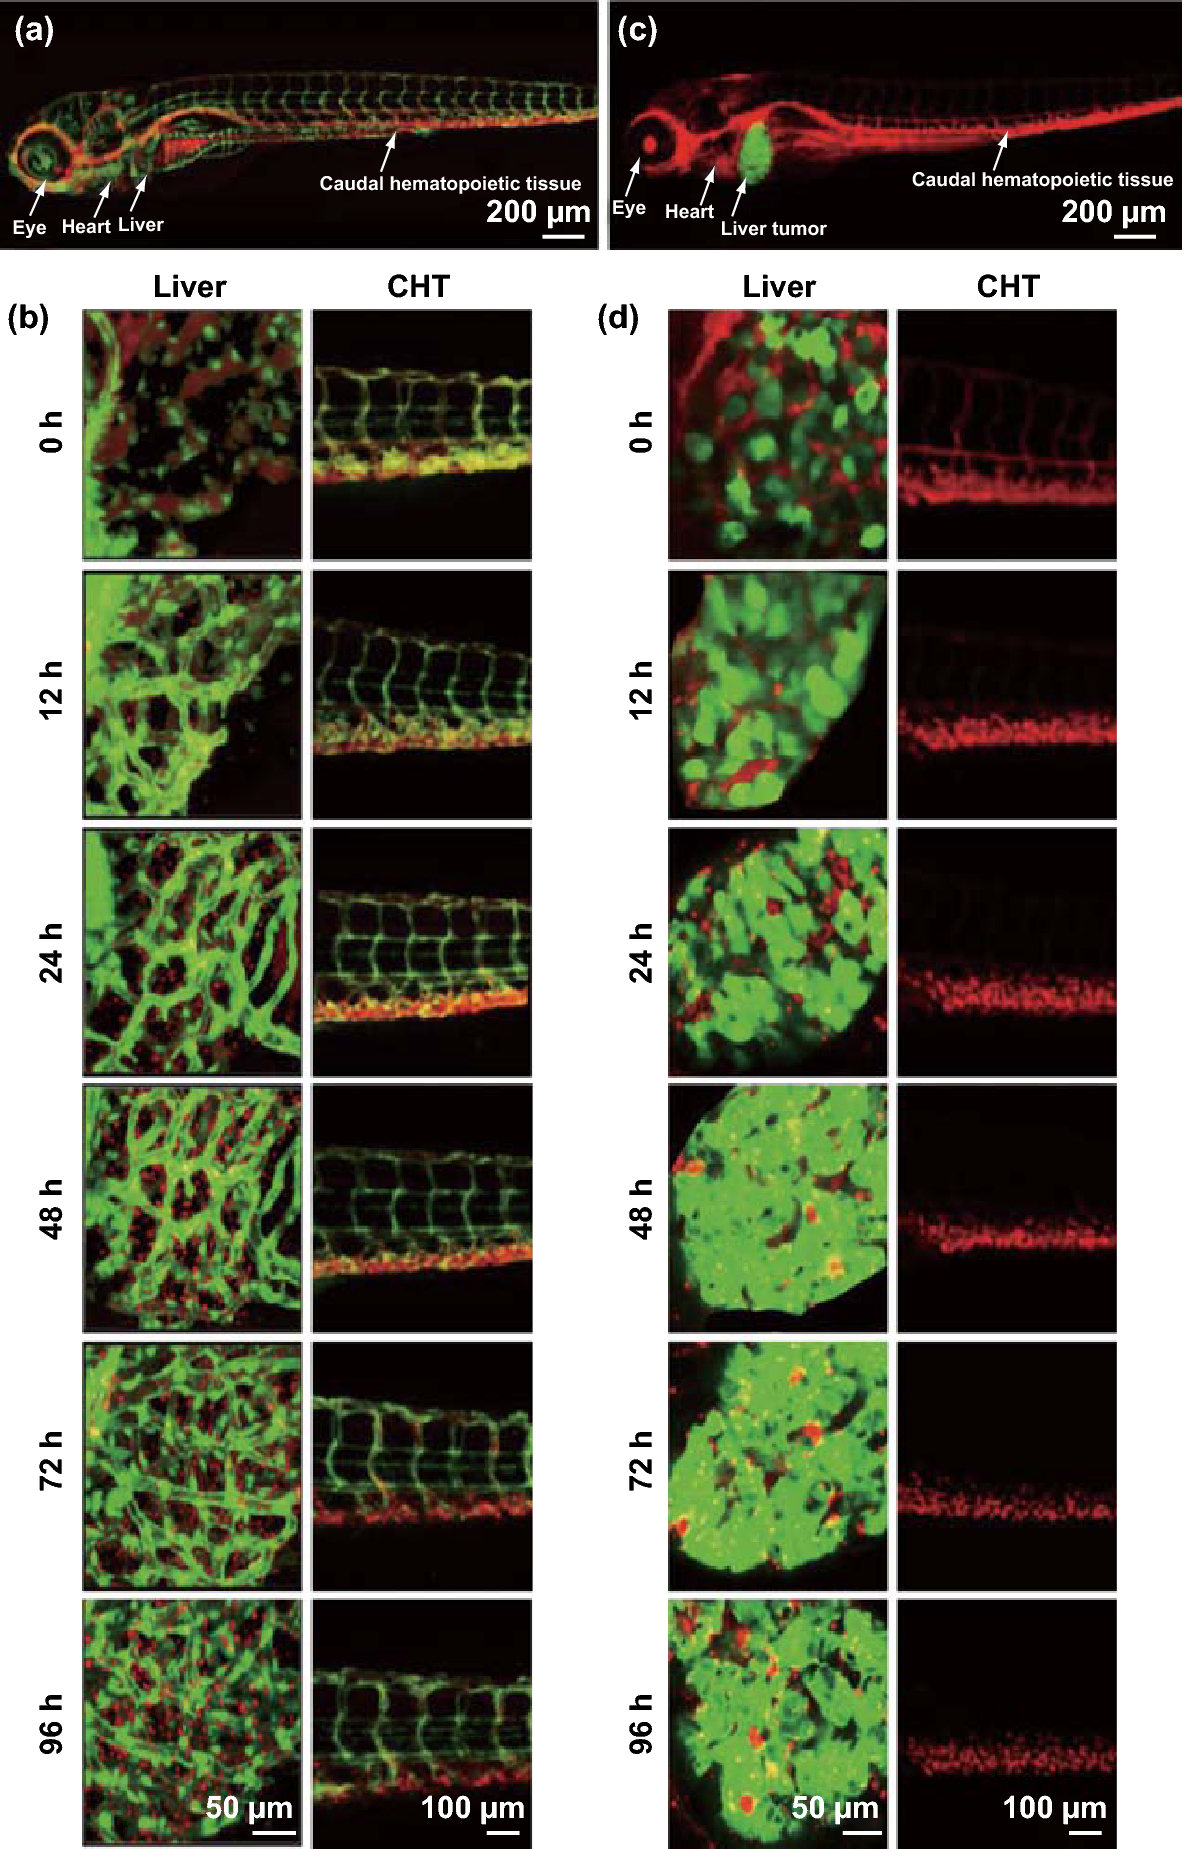
Fig. 3
a Confocal image of fli:EGFP zebrafish larva injected intravenously with 0.8 mg mL−1 PPDCT NPs. b Uptake and breakdown of NPs over time span of 96 h in the liver and caudal hematopoietic tissue (CHT) of fli:EGFP zebrafish liver. c Confocal image of EGFP:krasV12 zebrafish larva injected intravenously with 0.8 mg mL−1 PPDCT NPs. d Uptake and breakdown of NPs over time span of 96 h in the liver and CHT of EGFP:krasV12 zebrafish liver. Confocal λex = 488 nm, green fluorescent protein λem = 509 nm, PPDCT λem = 660 nm
Acknowledgments
This image is the copyrighted work of the attributed author or publisher, and
ZFIN has permission only to display this image to its users.
Additional permissions should be obtained from the applicable author or publisher of the image.
Full text @ Nanomicro Lett