
|
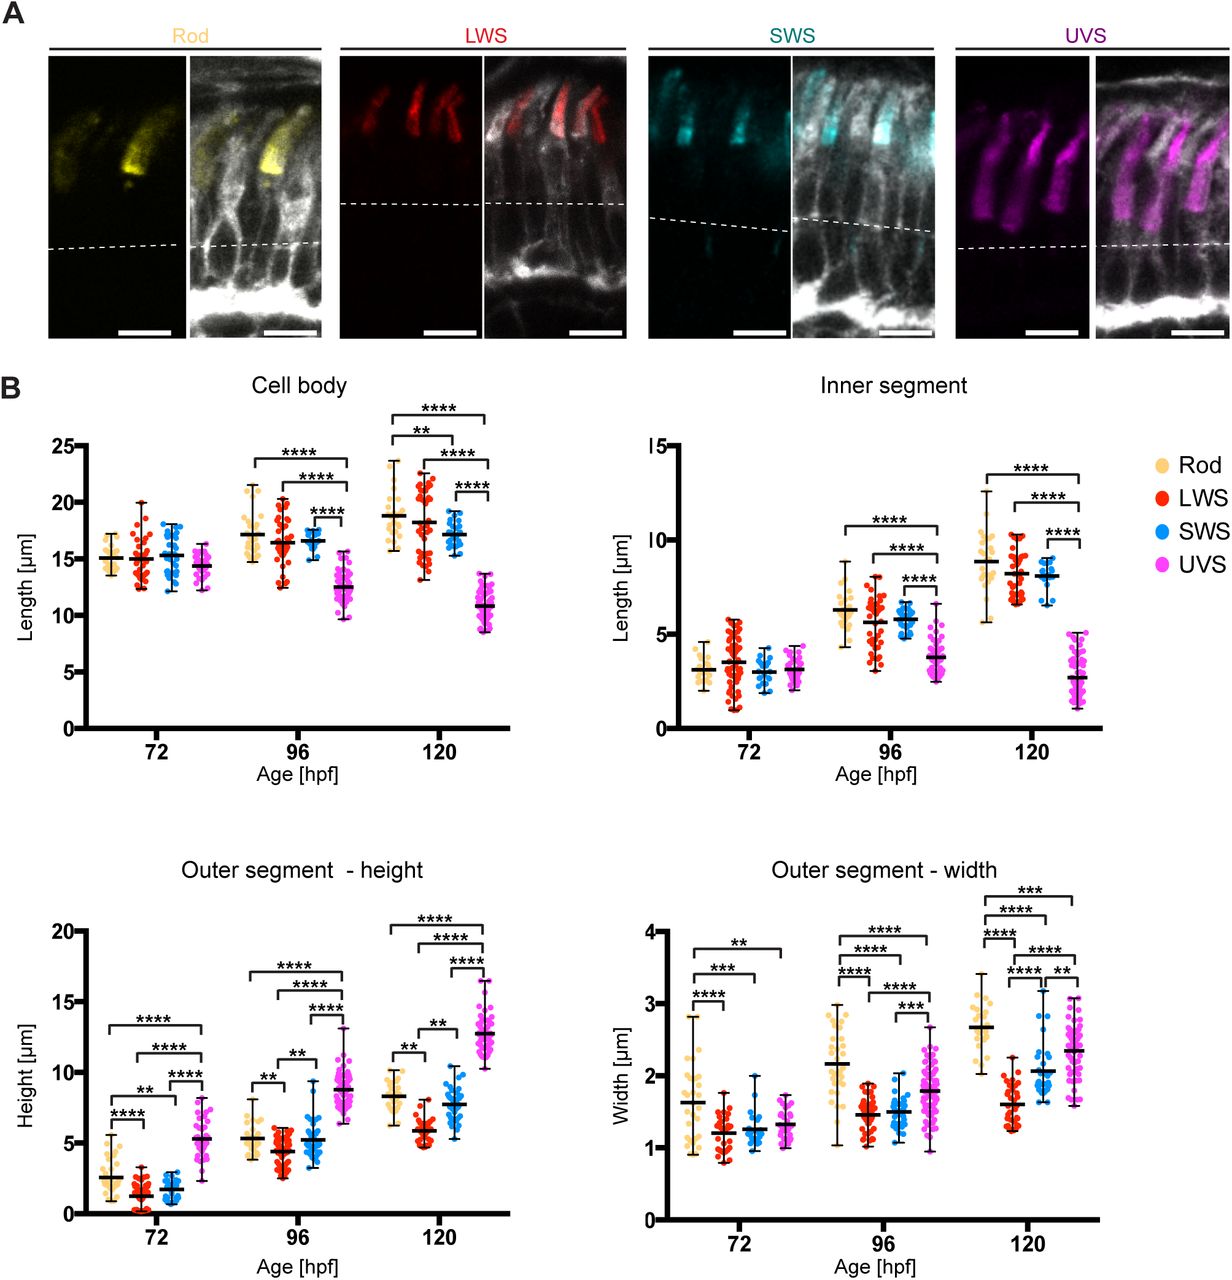
Fig. 2
PRC subtypes show different growth of the apical domain. (A) Confocal images of the PRC layer in retinal sections of Tg(rasGFP) embryos at 120 hpf, with plasma membrane in grey and antibody staining for different opsins: rhodopsin (yellow), red opsin (red), blue opsin (blue) and UV opsin (magenta). Dashed lines mark the level of the OLM. Scale bars: 5 µm. (B) Length of the cell body, the inner and the outer segment height and width at various stages are represented in dot plots with calculated minimum, mean, and maximum. On average, 40 cells from a total of 6–8 independent embryos were quantified per timepoint. Statistical significance was calculated by a two-way ANOVA followed by Tukey's multiple comparison test. Within the same time-point, all PRCs show no significant difference (P>0.05), with exception of samples highlighted with **(P≤0.01), ***(P≤0.001) and ****(P≤0.0001).