
|
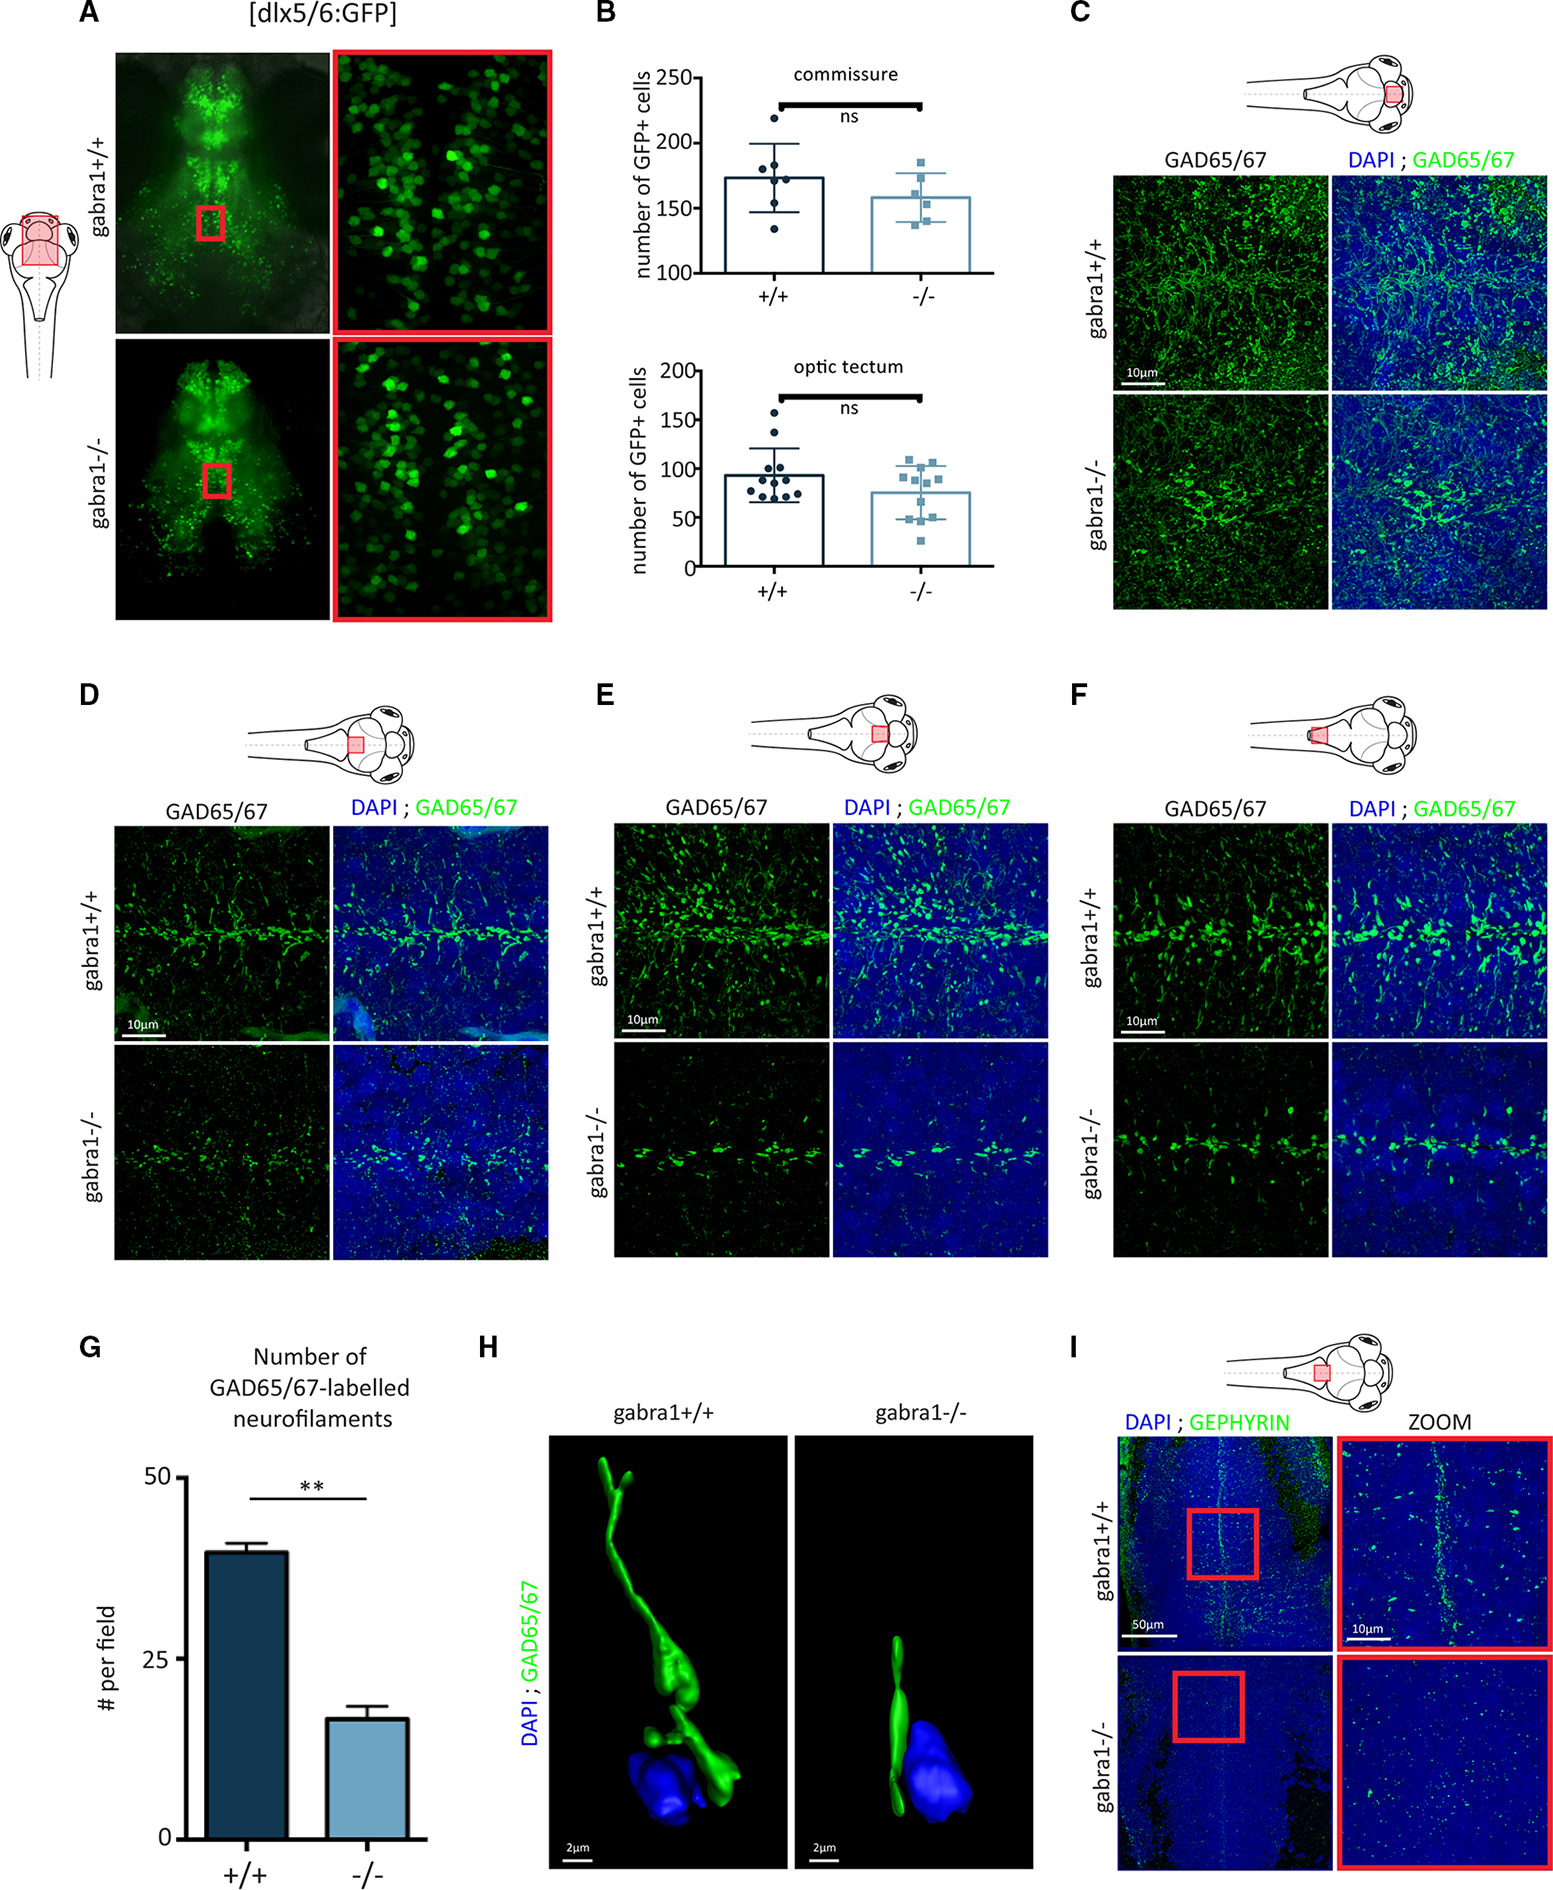
Fig. 6 Reduction of inhibitory synaptic connectivity in gabra1−/− mutants. A, Confocal imaging of 8 days postfertilization (dpf) larval brains from gabra1 × dlx5/6:GFP transgenic lines. B, Quantification of the number of green fluorescent protein (GFP)+ cells at the commissure (top) or projecting to the optic tectum (bottom). ns, not significant. C‐F, Fluorescent immunodetection of GAD65/67 (green) combined with 4,6‐diamidino‐2‐phenylindole (DAPI) labeling on cryostat sections of different brain regions from 6 dpf gabra1+/+ and gabra1−/− zebrafish embryos (scale bars = 10 μm): telencephalon (C), anterior part of optic tectum (D), posterior part of optic tectum (E), spinal cord (F). G, Quantification of GAD65/67‐labeled neurofilaments (n = 3, Student t test: **P = 0.0019). H, Imaris‐reconstructed three‐dimensional image with Gad65/67 shown in green and the nucleus (DAPI) shown in blue. Scale bar = 2 μm. I, Sagittal sections of 6 dpf gabra1+/+ and gabra1−/− embryos hybridized with an antibody directed against postsynaptic density gephyrin (green) and nuclei stained with DAPI (blue; scale bar = 50 μm). Magnified views of the regions boxed in white and red rectangles are shown (scale bar = 10 μm). A decreased accumulation of gephyrin expression was observed in gabra1−/− mutants. For each imaging, the same field of observation is shown for +/+ and −/− larvae, thus avoiding regional bias ... hide