
|
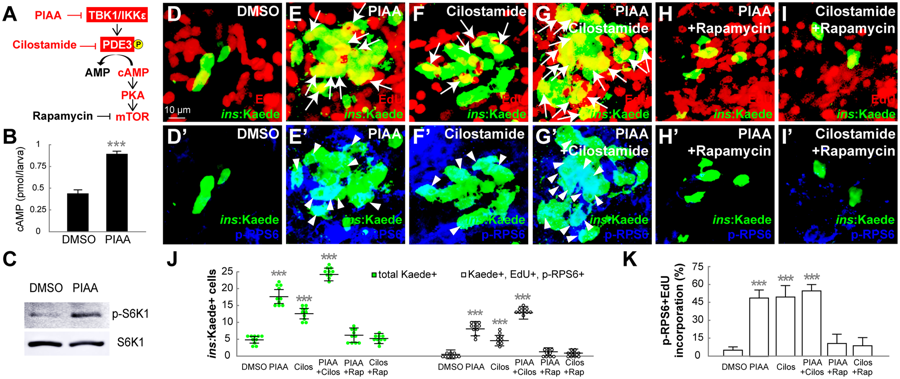
Fig. 6
Suppression of the TBK1/IKKε-PDE3 signaling axis promotes β-cell proliferation by increasing cAMP levels and mTOR activity. (A) Schematic of the TBK1/IKKε-PDE3 signaling that modulates cAMP-PKA-mTOR pathway. The sites of inhibition by PIAA and cilostamide are shown in red. (B) Quantification of cAMP levels (mean ± SD) at 48 hpa (0.4 ± 0.1 pmol/larva (DMSO) and 0.9 ± 0.0 pmol/larva (PIAA)). (C) Representative Western blot showing increased pS6K1 levels in PIAA-treated recovering larvae. (D-I’) Confocal images of [Tg(ins:CFP-NTR)s892; Tg(ins:Kaede)jh6] larvae at 48 hpa, concurrently treated with EdU and DMSO (D-D’), PIAA (E-E’), cilostamide (F-F’), a combination of PIAA and cilostamide (G-G’), a combination of PIAA and rapamycin (H-H’), or a combination of cilostamide and rapamycin (I-I’), respectively, from 0–48 hpa, stained for pRPS6 (blue). The number of EdU-incorporated (white arrows) and pRPS6-positive (white arrowheads) β-cells was increased in recovering larvae treated with both PIAA and cilostamide (G,G’) compared to individual compound-treated larvae (E-E’ and F-F’). Rapamycin substantially suppressed the PIAA- and cilostamide-dependent increases in the number of EdU-incorporated and pRPS6-positive β-cells (H-I’). (J) Quantification of the number (mean ± SD) of total regenerated β-cells (green bars) and regenerated β-cells that incorporated EdU with pRPS6 immunoreactivity (white bars) at 48 hpa (in D-I’; 5.0 ± 1.3 total regenerated β-cells, of which 0.3 ± 0.5 (DMSO), 17.8 ± 2.8, of which 8.4 ± 1.7 (PIAA), 12.7 ± 1.9, of which 5.0 ± 1.5 (cilostamide), 24.7 ± 1.2, of which 13.3 ± 0.6 (PIAA and cilostamide), 6.0 ± 2.0, of which 1.0 ± 1.0 (PIAA and rapamycin), and 5.2 ± 1.1, of which 0.8 ± 0.8 (cilostamide and rapamycin) incorporated EdU with pRPS6 immunoreactivity). (K) The percentage (mean ± SD) of regenerated β-cells that incorporated EdU with pRPS6 immunoreactivity at 48 hpa (in D-I’; 6.1 ± 9.5% (DMSO), 47.3 ± 7.5% (PIAA), 50.4 ± 8.8% (cilostamide), 54.2 ± 4.2% (PIAA and cilostamide), 13.9 ± 12.7% (PIAA and rapamycin), and 13.7 ± 13.0% (cilostamide and rapamycin)). Cells in 20 planes of confocal images from 10 individual larvae were counted per condition. ***P < 0.001.