
Fig. 1
- ID
- ZDB-IMAGE-181130-6
- Publication
- Roussigné et al., 2018 - Left/right asymmetric collective migration of parapineal cells is mediated by focal FGF signaling activity in leading cells
- All Figures
- Figures for Roussigné et al., 2018
|
Fig. 1
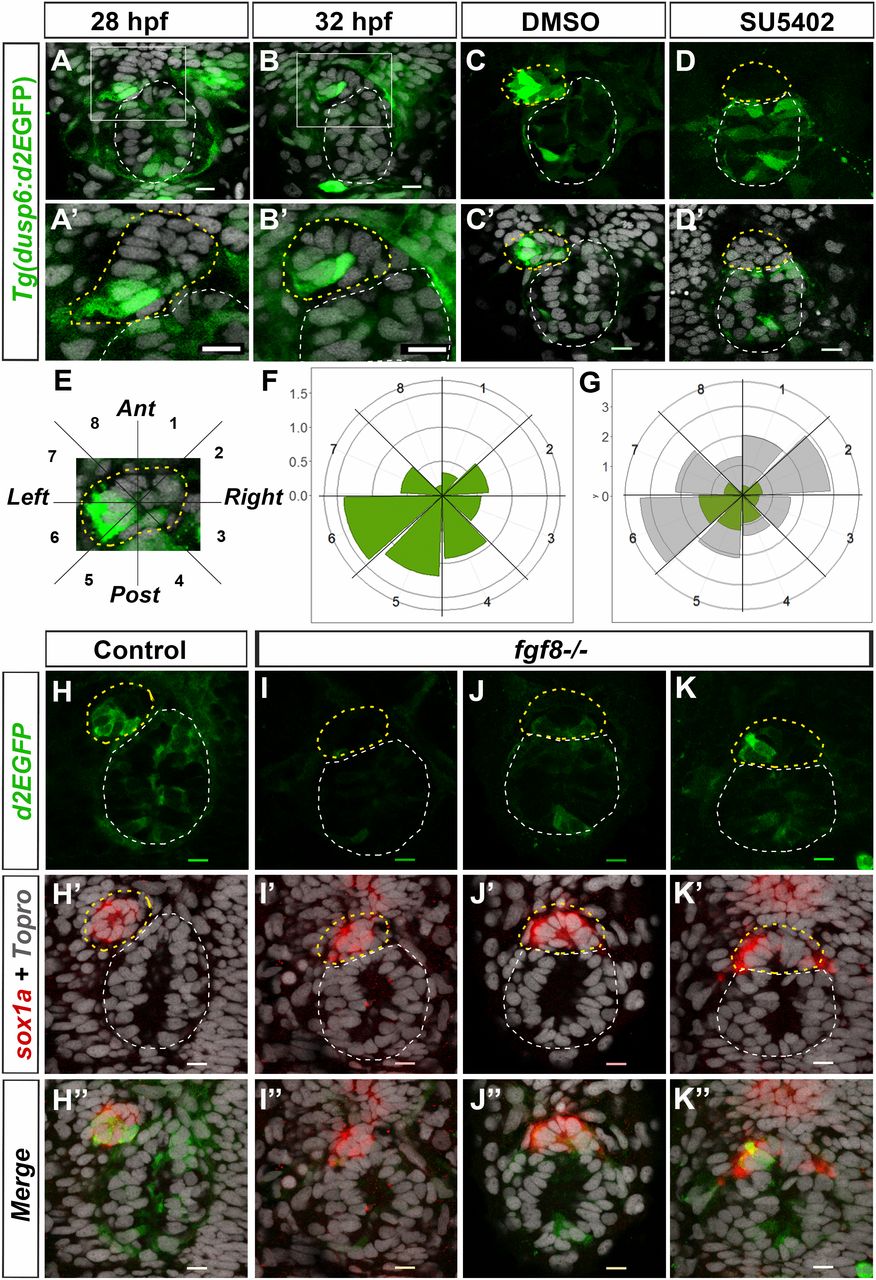
The Tg(dusp6:d2EGFP) FGF pathway reporter is focally activated in the parapineal by Fgf8. (A–B′) Confocal sections showing expression of Tg(dusp6:d2EGFP) (green) in the epithalami of 28-hpf (A) or 32-hpf (B) embryos with cell nuclei labeled (Topro-3, gray) visualizing the epiphysis (white circle) and parapineal (yellow circle). White boxes in A and B are magnified in A′ and B′. (C–D′) Confocal maximum projections (C and D) or sections (C′ and D′) of the epithalami of 35-hpf Tg(dusp6:d2EGFP) embryos treated with DMSO (C and C′) or SU5402 (D and D′) immunostained for GFP (green) and additionally for nuclei (C′ and D′; gray). In the control embryos (C and C′; n = 10), Tg(dusp6:d2EGFP) is expressed in both the epiphysis and the parapineal; in the SU5402 treated embryos (D and D′; n = 11), Tg(dusp6:d2EGFP) is absent in the parapineal. (E) Image of a 32-hpf parapineal defining eight 45 °C semiquadrants (1–8) along the antero-posterior and LR axes relative to the mean position of the parapineal (center). (F and G) Polar graphs showing the distribution and mean number of total (G, gray) or Tg(dusp6:d2EGFP)+ (F and G, green) parapineal cells in each 45 °C semiquadrant relative to the parapineal mean position (center) at 32 hpf; the distribution of total (gray) and Tg(dusp6:d2EGFP)+ cells (green) are shown at the same scale in G. The radial axis (vertical scale on the left side of polar graphs) represents the mean number of cells per semiquadrant (n = 27 embryos). (H–K″) Confocal sections showing the expression of Tg(dusp6:d2EGFP) (green) and sox1a (red) at 32 hpf in control embryos (H–H″; n = 34) and in three illustrative fgf8−/− mutant embryos (I–K″) displaying no expression (I and I′) weakly and barely lateralized expression (J–J″) or relatively normally patterned (K and K″). The distribution and mean number of Tg(dusp6:d2EGFP)- and sox1a-expressing cells are quantified in SI Appendix, Fig. S2. In all panels (A–D′ and H–K″), embryo view is dorsal, anterior is up. (Scale bars, 10 µm.)