
IMAGE
Fig. 4
- ID
- ZDB-IMAGE-181130-26
- Genes
- Antibodies
- Publication
- Castillo-Robles et al., 2018 - smarce1 mutants have a defective endocardium and an increased expression of cardiac transcription factors in zebrafish
- All Figures
- Figures for Castillo-Robles et al., 2018
Image
|
Figure Caption
Fig. 4
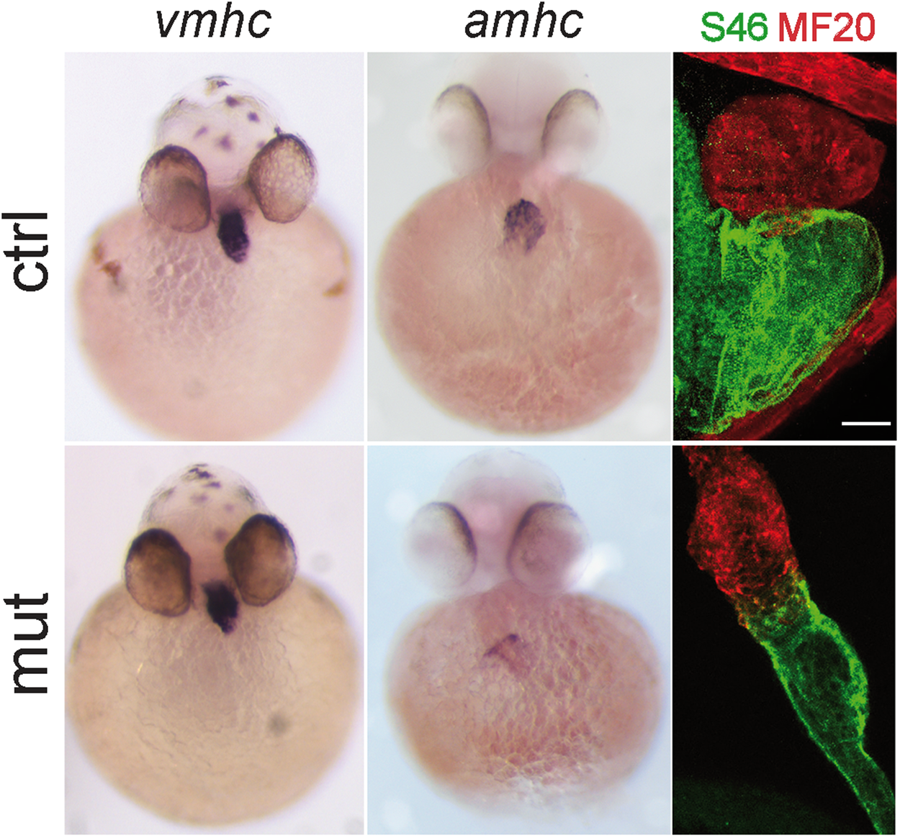
Patterns of expression of atria and ventricle markers in smarce1 mutants. Chamber expression in smarce1 heterozygous (upper panel) and homozygous (lower panel) embryos. Left to right: 48 hpf embryos showing the expression of the ventricular cardiomyocyte marker vmhc, embryos showing the expression of the atria cardiomyocyte marker amhc, 72 hpf embryos stained with MF20 and S46 antibodies to detect the ventricle (red) and atrium (green) in wildtype and mutant embryos. Scale bar: 25 μm.
Figure Data
Acknowledgments
This image is the copyrighted work of the attributed author or publisher, and
ZFIN has permission only to display this image to its users.
Additional permissions should be obtained from the applicable author or publisher of the image.
Full text @ Sci. Rep.