
Image
|
Figure Caption
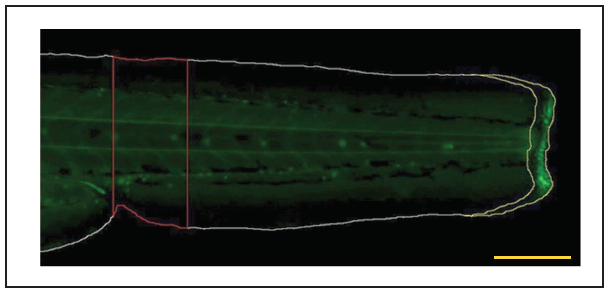
Fig. S14
Methods image to illustrate fluorescence quantification. The picture shows a screenshot of ImageJ/Fiji Wound-induced HO quantification macro to illustrate how regions for quantification are set. The fish, wound area and trunk regions outlined in white, yellow and red, respectively. Scale bar is 200μm.
Acknowledgments
This image is the copyrighted work of the attributed author or publisher, and
ZFIN has permission only to display this image to its users.
Additional permissions should be obtained from the applicable author or publisher of the image.
Full text @ Nat. Commun.