
Image
|
Figure Caption
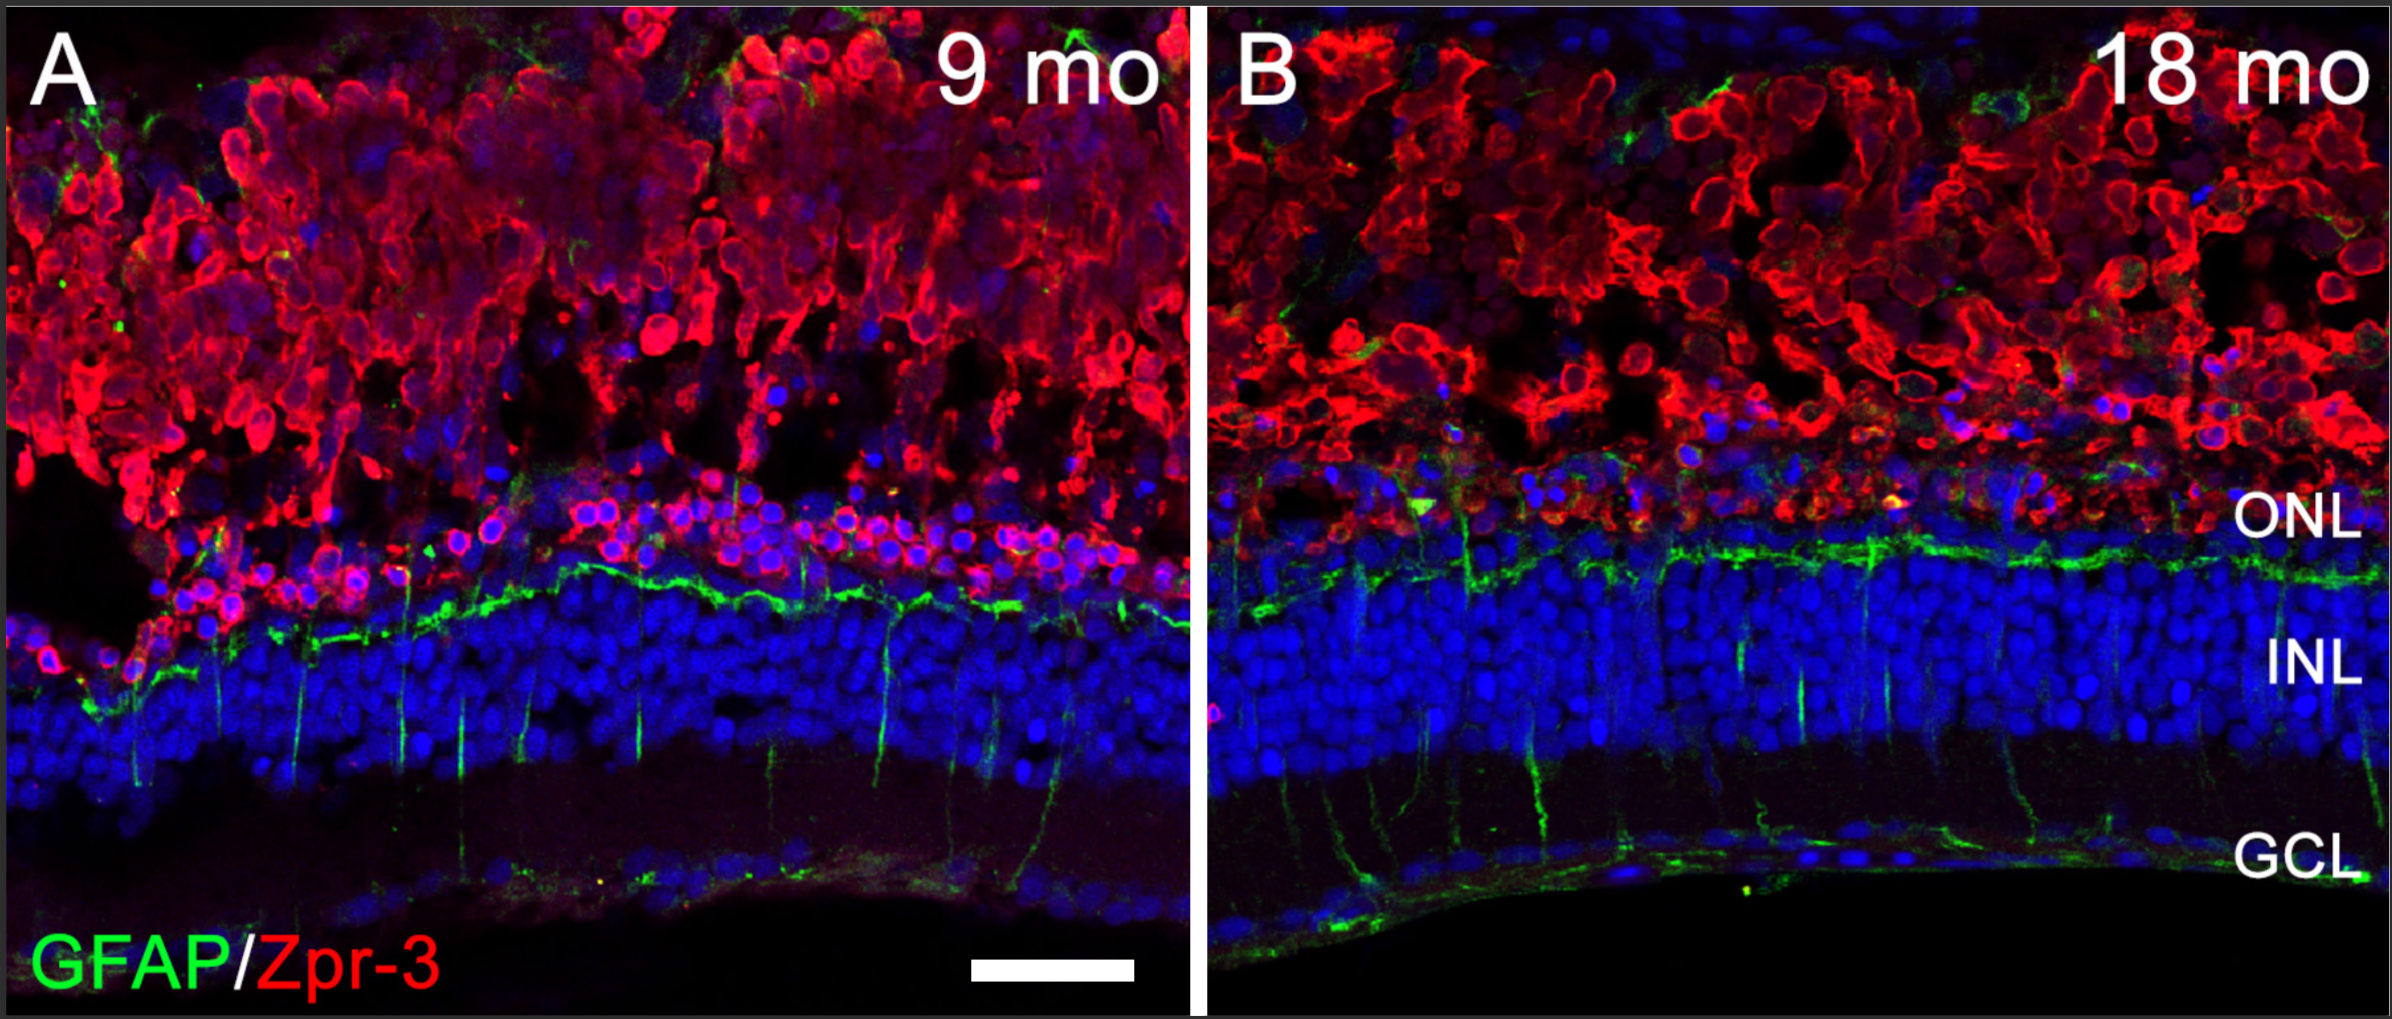
Fig. S1
Comparison of photoreceptor degeneration and GFAP expression at 36 hpL between 9 and 18 mo zebrafish
(A–B) Retinal sections from 9 mo (A) and 18 mo (B) zebrafish immunolabeled with GFAP (Müller glia; green), Zpr-3 (Rod photoreceptors; red), and the nuclear stain TO-PRO-3 (blue). No differences in Müller glial reactivity or photoreceptor degeneration was observed. Scale bar represents 25 μm.
Acknowledgments
This image is the copyrighted work of the attributed author or publisher, and
ZFIN has permission only to display this image to its users.
Additional permissions should be obtained from the applicable author or publisher of the image.
Full text @ Peer J.