
Image
|
Figure Caption
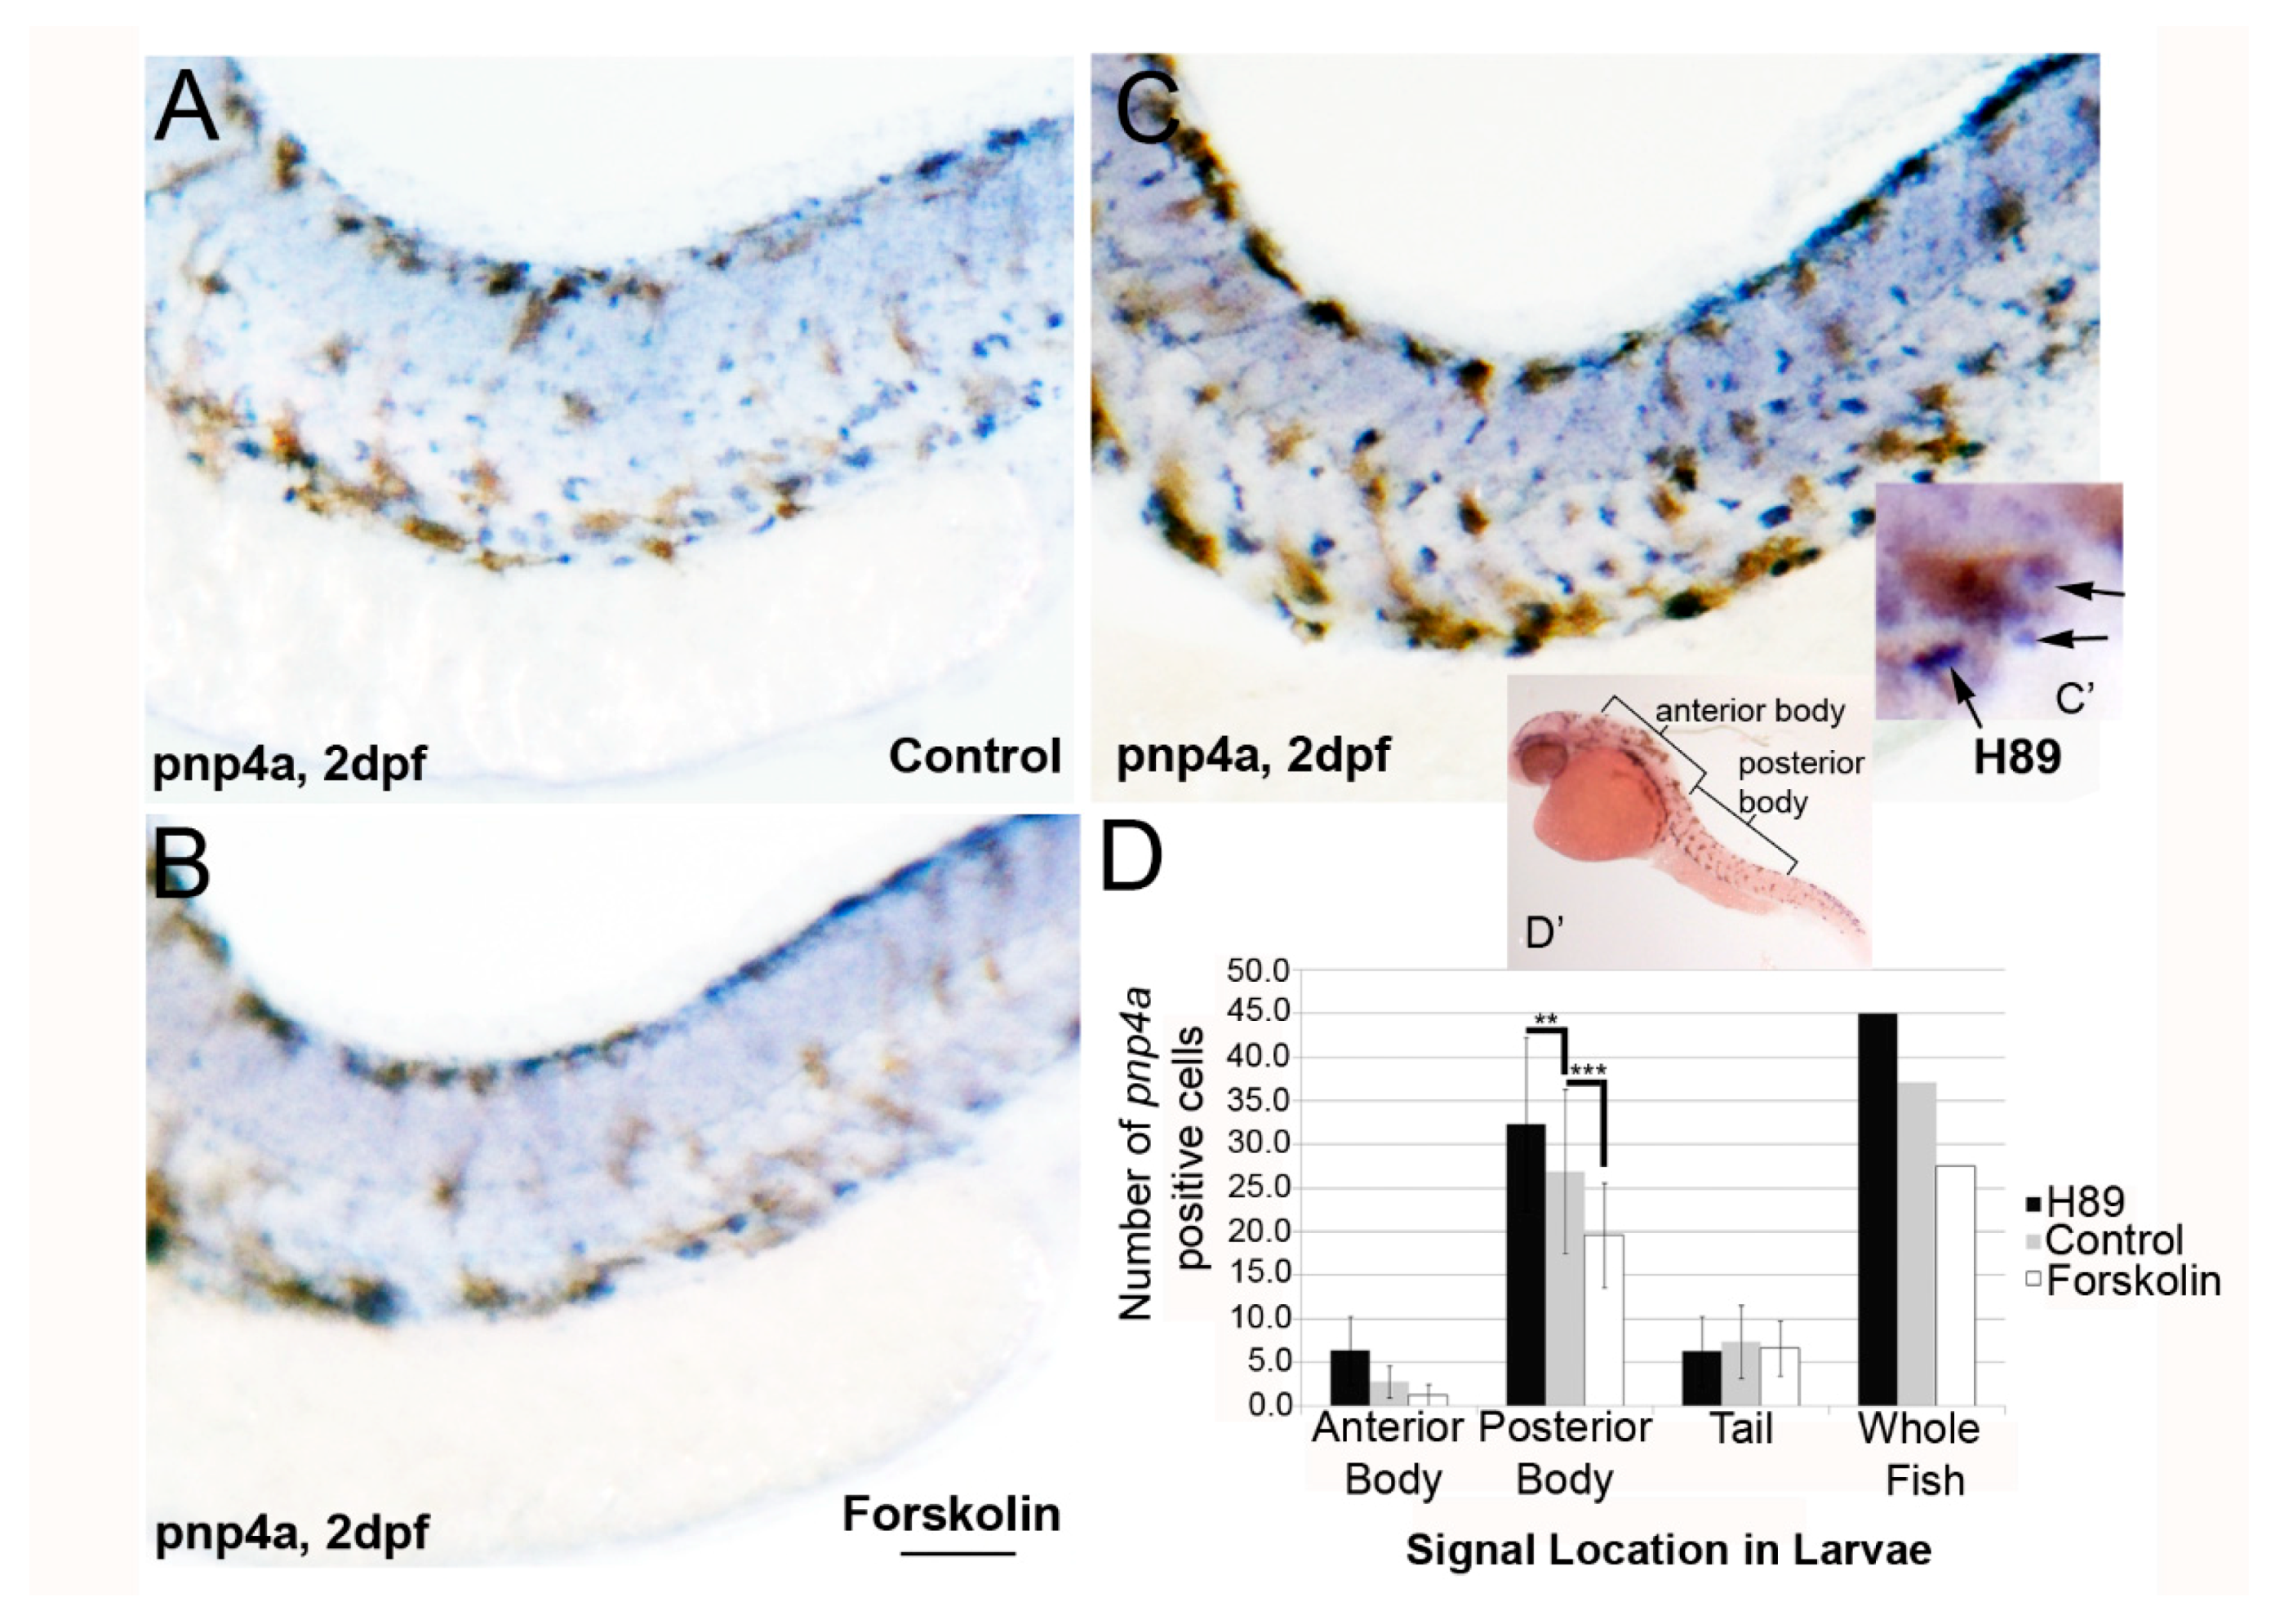
Fig. 3
Forskolin treatment reduces iridoblast marker pnp4a expression. (A–C) Lateral brightfield images of larvae at 2 dpf processed for in situ hybridization using pnp4a probes, following treatment with 0.1% DMSO (A), 5 µM forskolin (B), or 25 µM H-89 (C) in embryo media. Activation of adenylyl cyclase (and PKA signaling) reduces the levels of pnp4a expression, whereas inhibition of PKA has the converse effect (increased pnp4a expression). Scale bar = 200 um andapplies to all images. (C’) Representative image with black arrows showing blue/purple pnp4+ cells included in panel D quantification. Brown melanophores were not included in counts. (D) Quantification of pnp4a+ cells confirms a significant reduction and increase in the number of pnp4a+ cells following forskolin and H-89 treatment, respectively (** p < 0.01 and *** p < 0.0001 via two-way ANOVA and Bonferonni multiple comparison analysis). (D’) The quantified regions are labeled.
Acknowledgments
This image is the copyrighted work of the attributed author or publisher, and
ZFIN has permission only to display this image to its users.
Additional permissions should be obtained from the applicable author or publisher of the image.
Full text @ J Dev Biol