
|
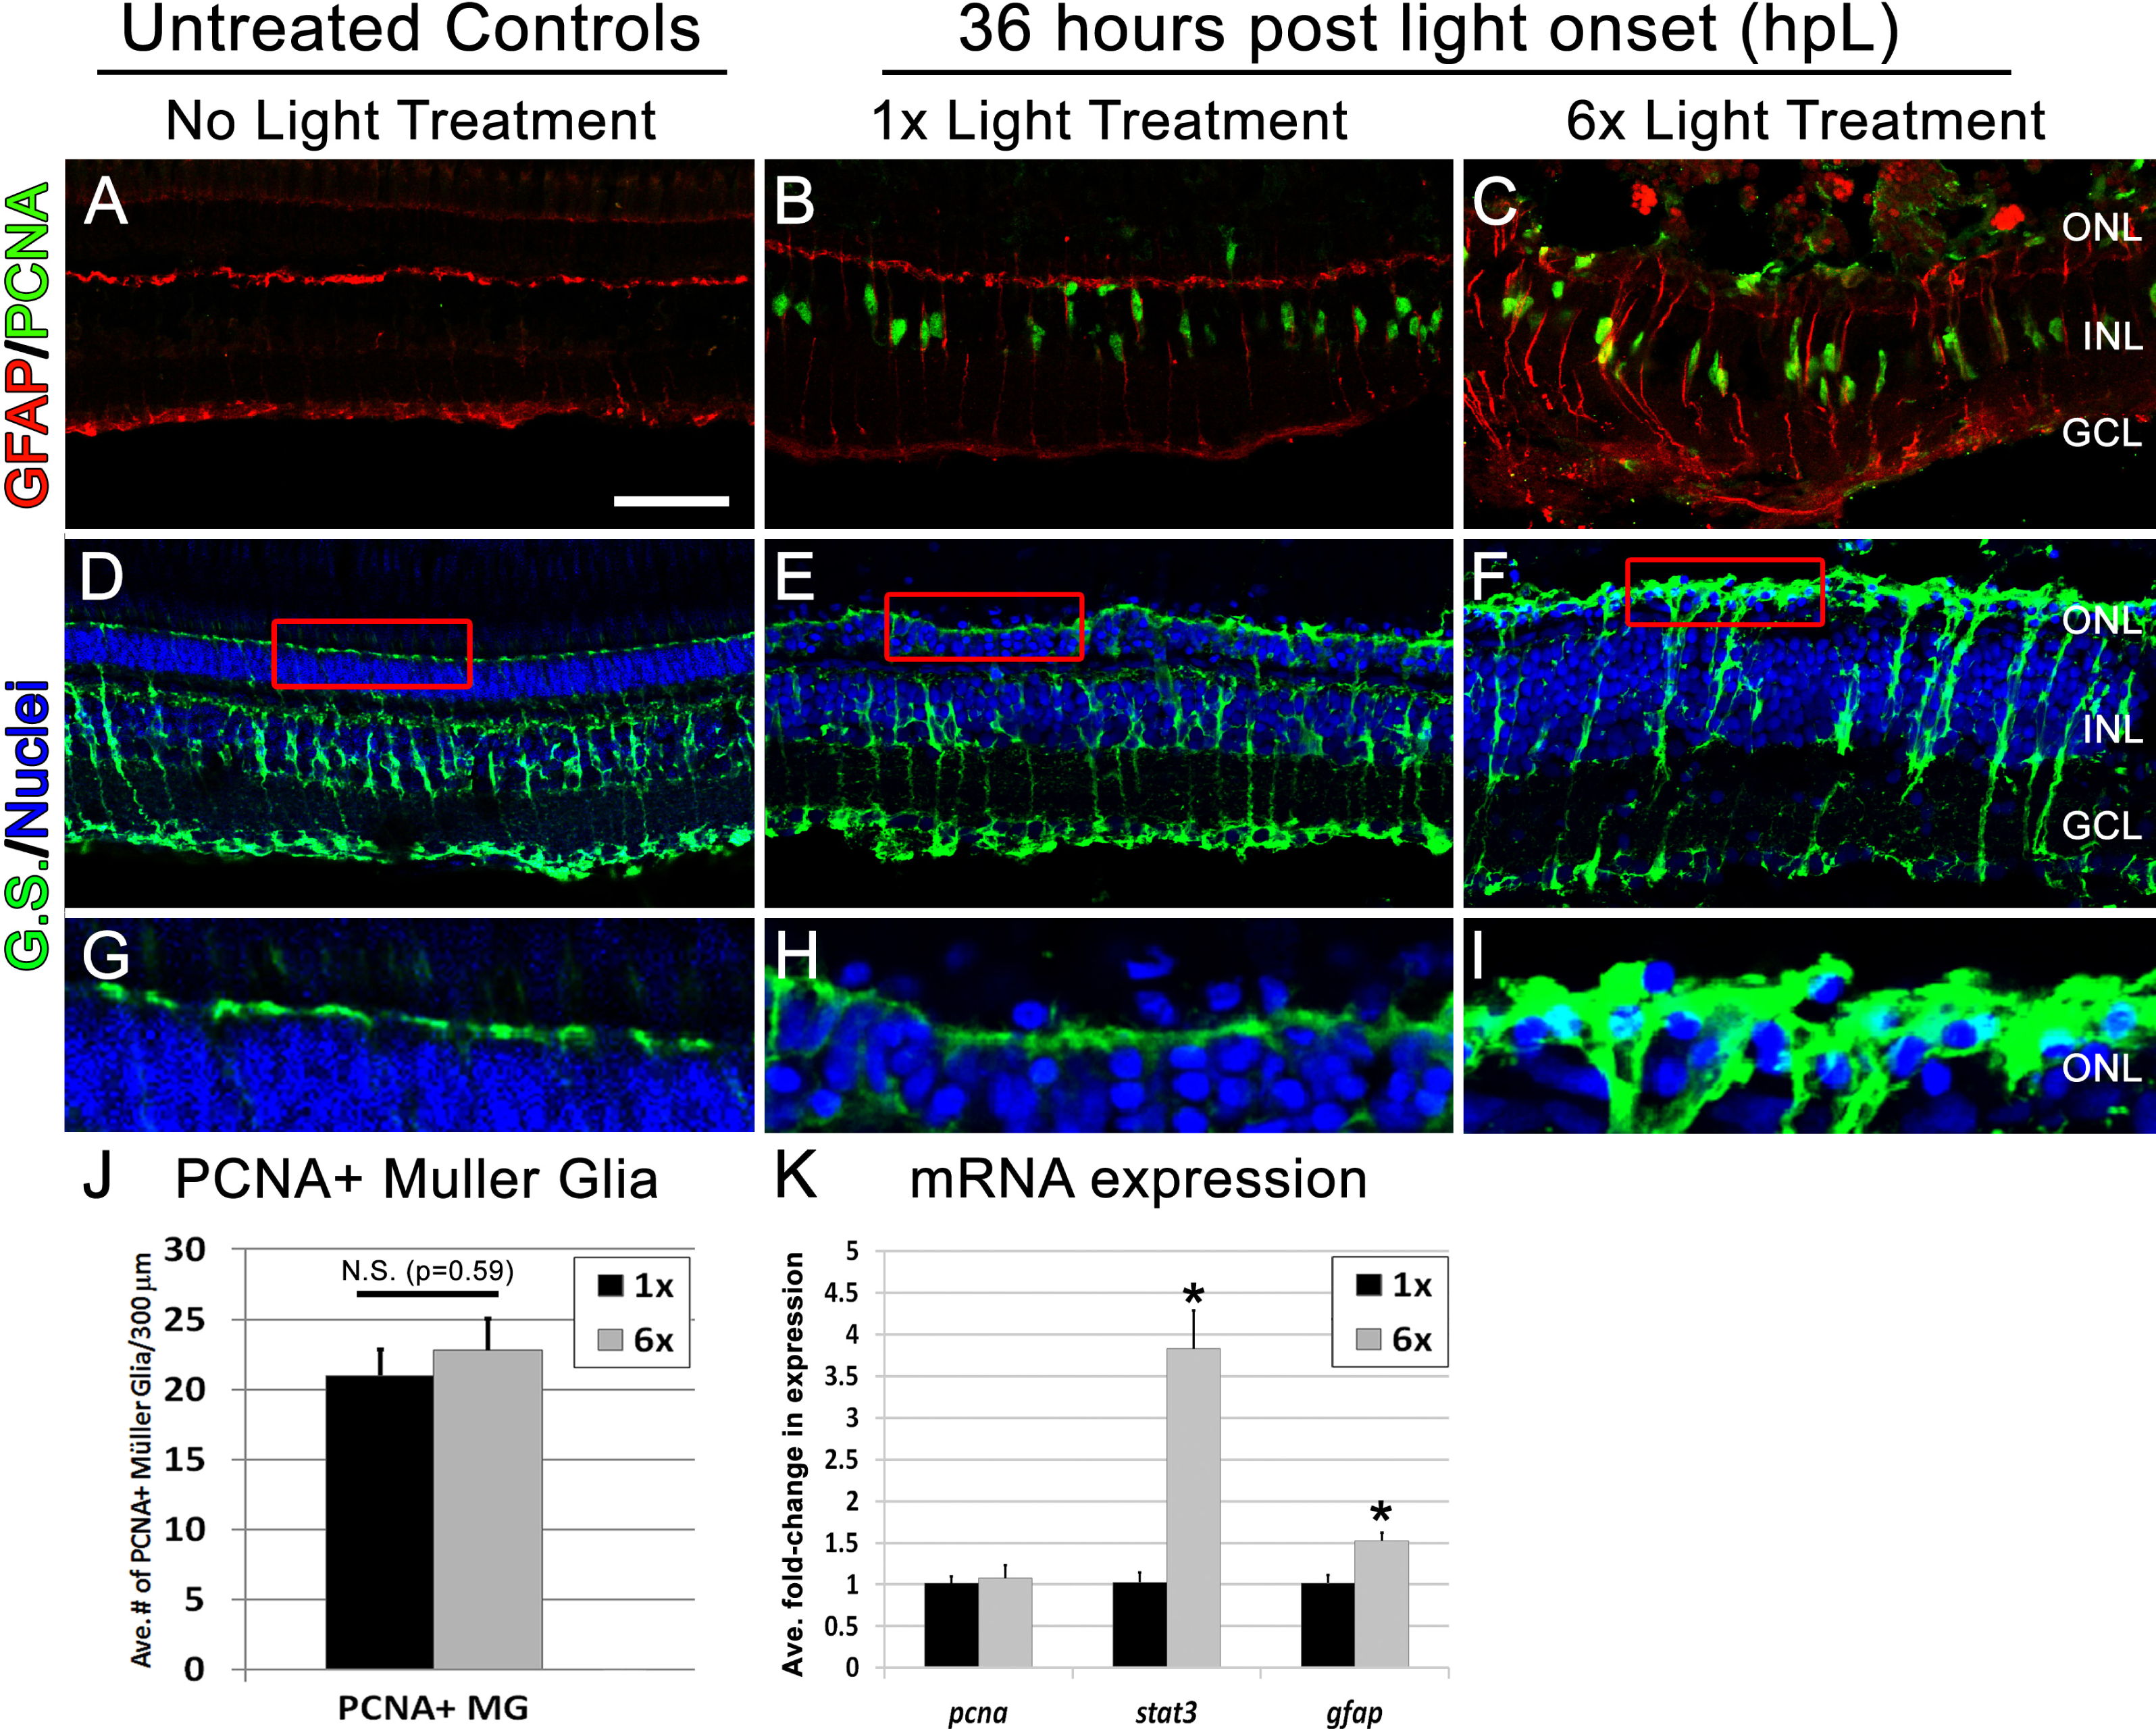
Fig. 3
Following six rounds of light treatment Müller glia become highly unorganized and exhibit gliotic characteristics.(A–C) Retinal sections collected at 36 hpL immunolabeled with anti-GFAP (red), and anti-PCNA (green) in untreated control (No Light Treatment), experimental control (1×Light Treatment), and experimental retinas (1×Light Treatment). (D–F) Retinal sections collected at 36 hpL immunolabeled with anti-glutamine synthetase (G.S.; green) and TO-PRO-3 as nuclear stain (blue). (G–I) Magnified inset of regions indicated by red box in (D–F). (J) Quantification of average number of PCNA positive Müller glia in experimental control and experimental groups (n = 5). Cells were counted over a linear distance of 300 µm on the central dorsal retina. (K) Graph showing the average fold-change in expression of genes associated with proliferation (pcna) and gliosis/stress (stat3, gfap) as determined by real-time qPCR. Asterisk indicates significantly different from control (p < 0.05). Scale bar represents 25 μm.