
|
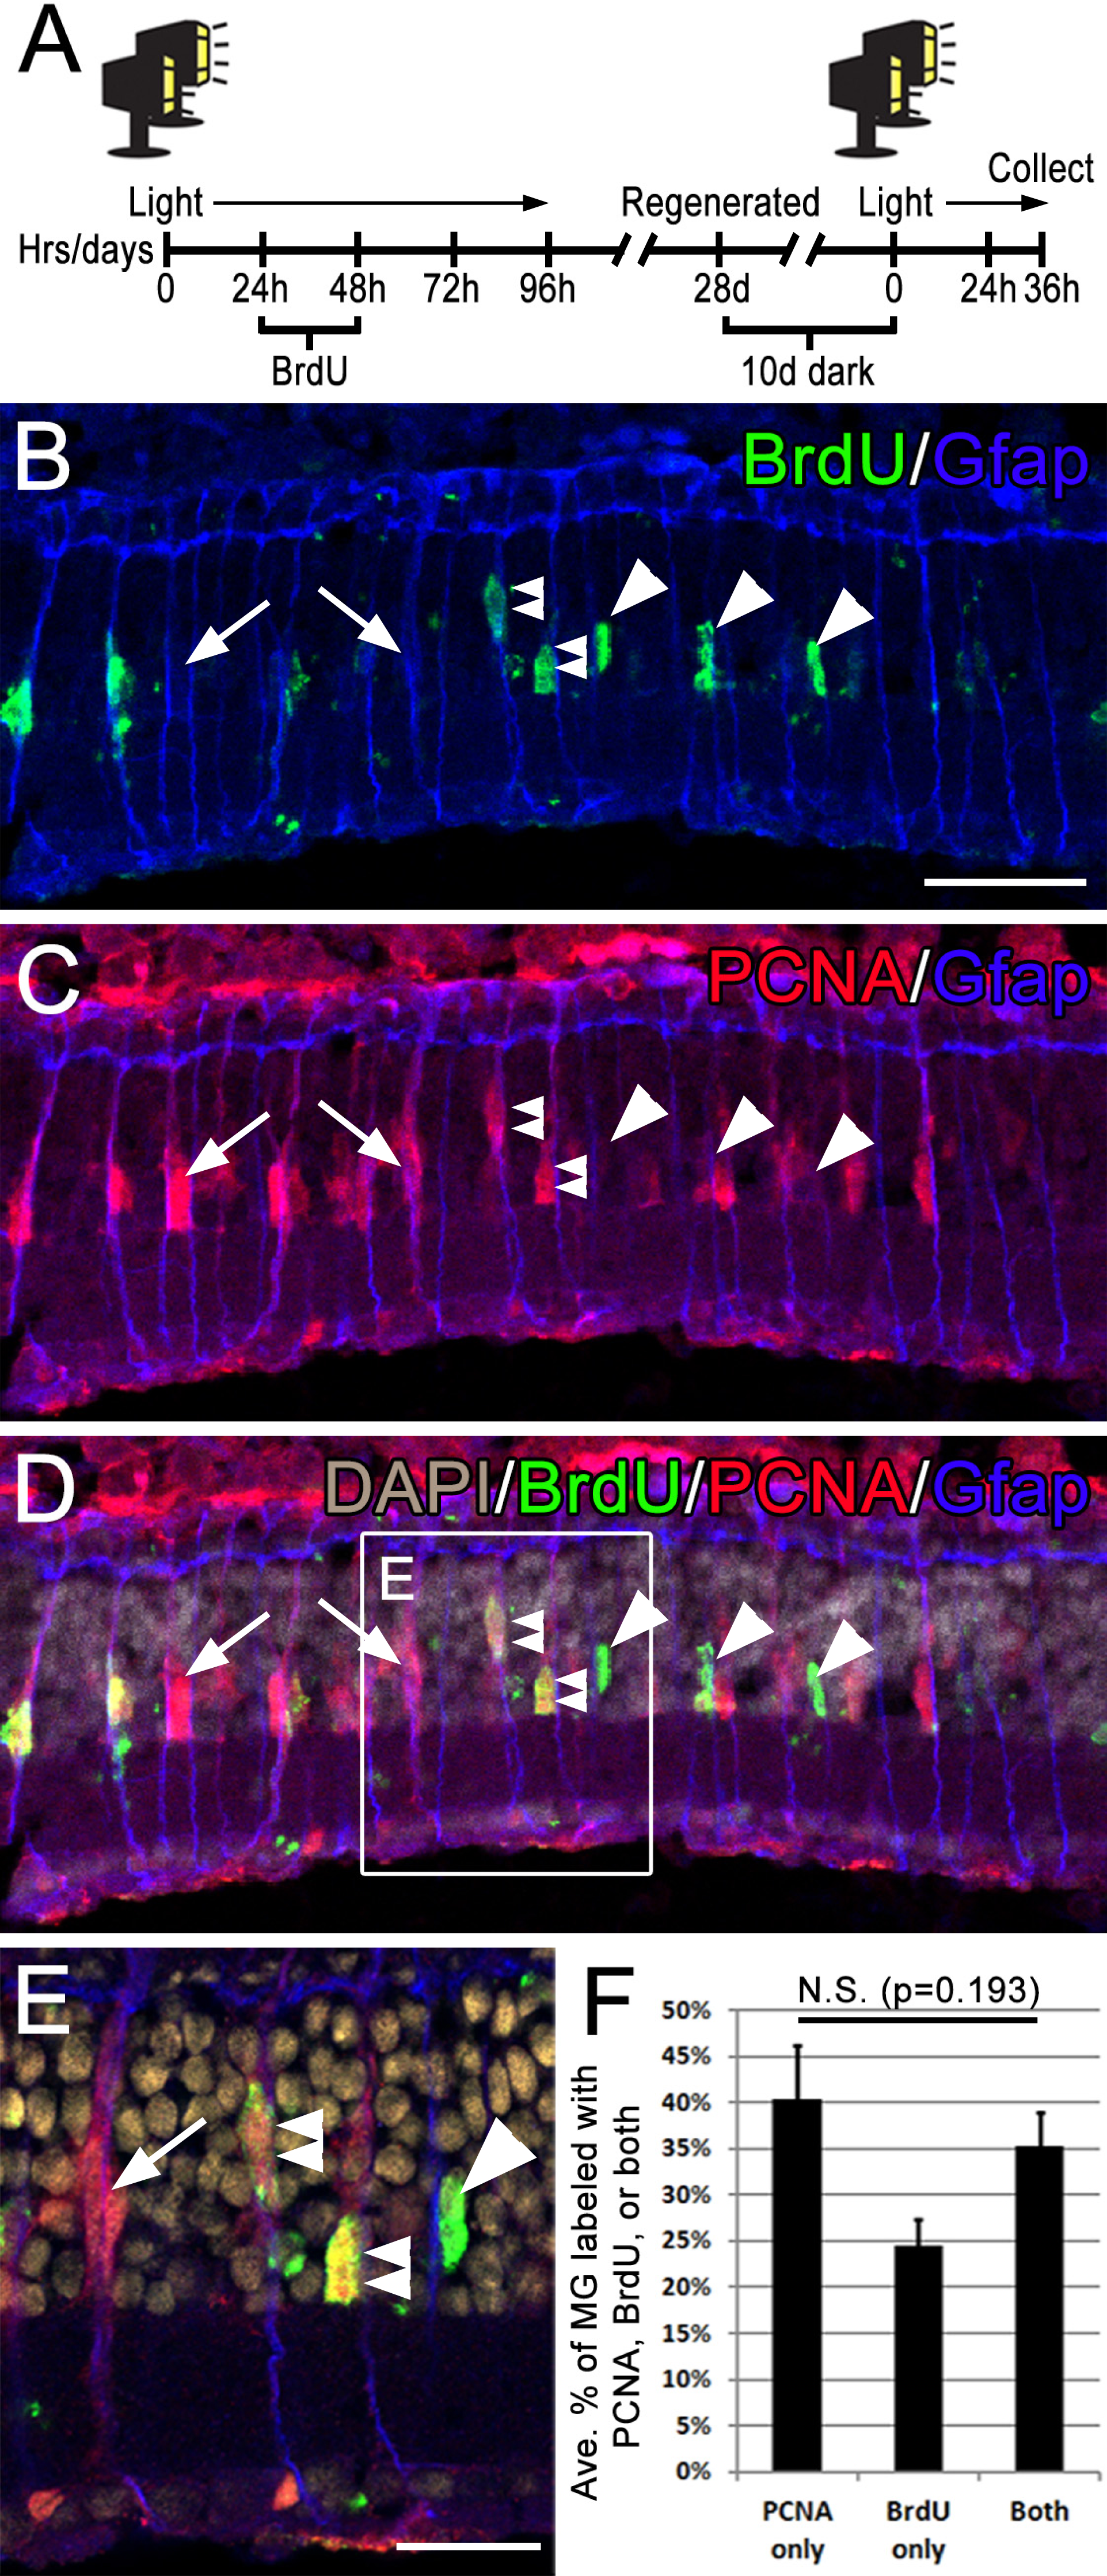
Fig. 1
Following consecutive rounds of light damage, different populations of Müller glia re-enter the cell cycle.(A) Timeline of the BrdU and light lesion, fish were exposed to two rounds of light lesion separated by 28 day period of standard light/dark cycling. (B–D) Retinal sections collected at 36 hpL immunolabeled with anti-GFAP (blue), anti-BrdU (green), anti-PCNA (red) and DAPI (nuclear stain; grey). Arrowheads point to BrdU-positive cells, arrows point to PCNA-positive cells, and double arrowheads point to cells co-immunolabeled with both PCNA and BrdU. (E) An inset of image D. (F) Quantification of the average numbers of BrdU-positive cells (24%), PCNA positive cells (40%) and co-labeled cells (35%) counted over a linear distance of 300 µm on the central dorsal retina following two consecutive rounds of light damage. Scale bar represents 25 µm in B and 12 µm in E.