
|
Fig. S1
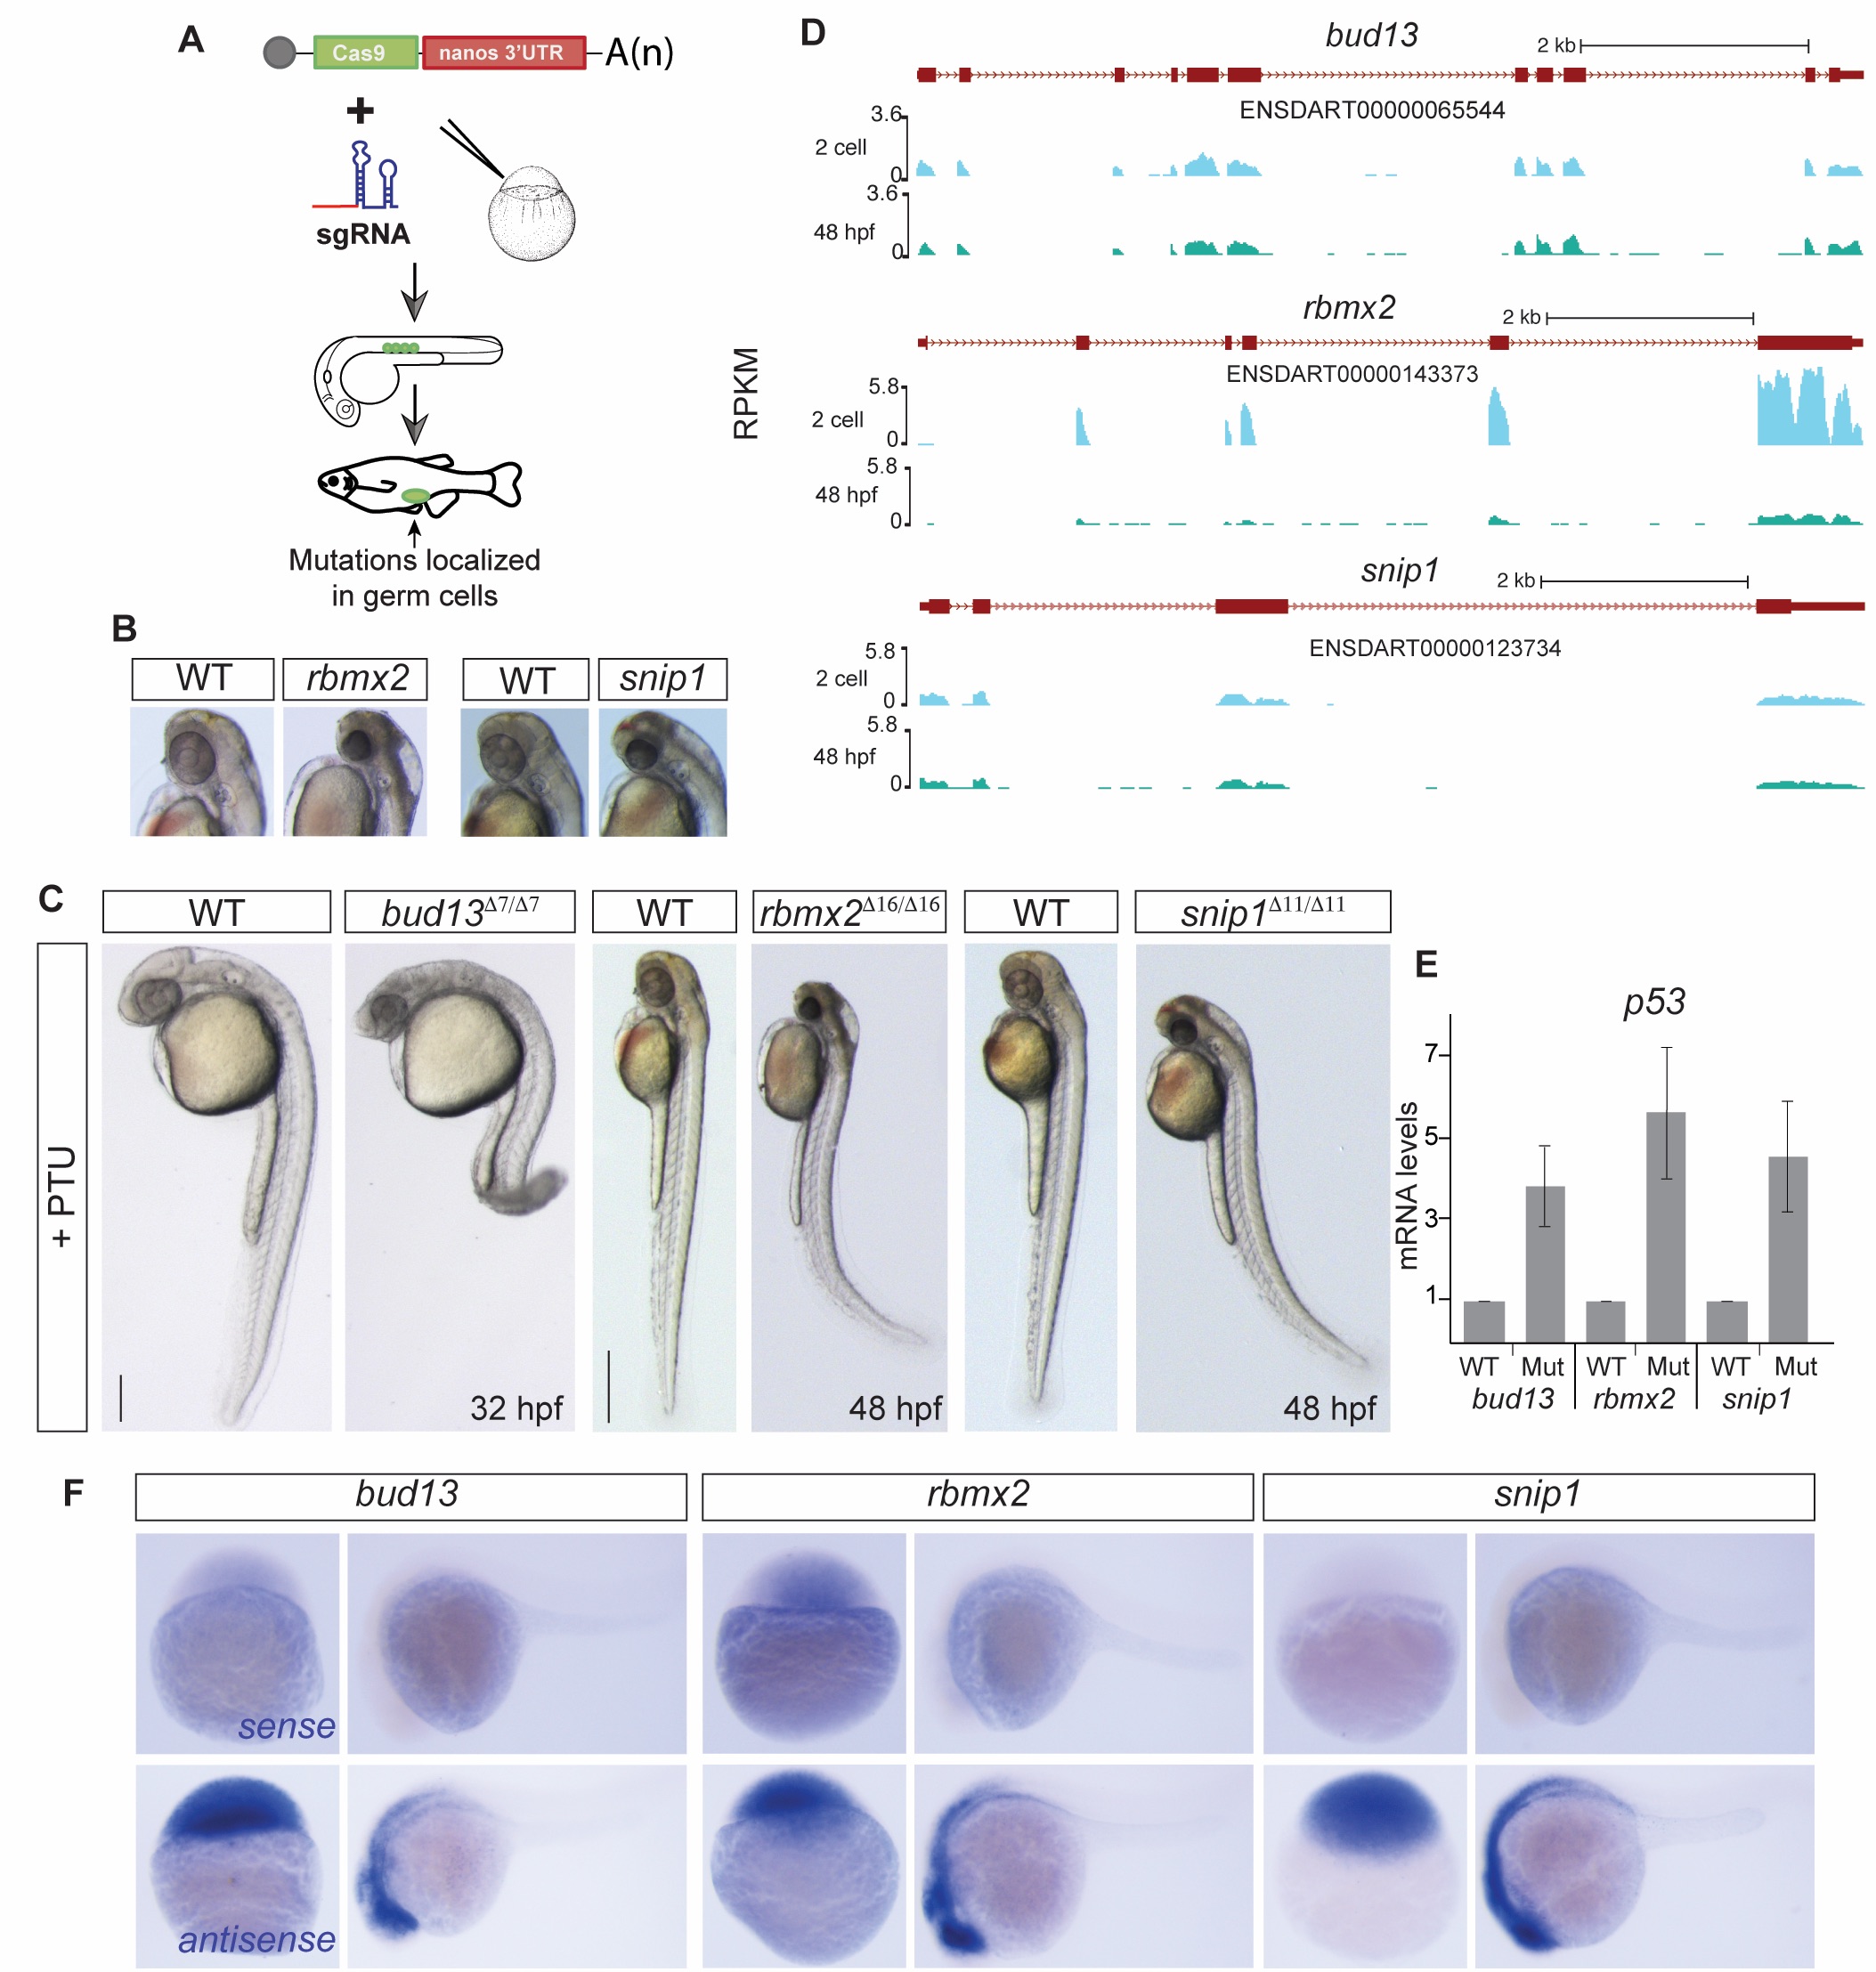
RES complex is required during zebrafish development.
(A) Scheme illustrating the Cas9-nanos 3′-UTR strategy [20]. The nanos' 3′-UTR concentrates the expression of Cas9 in the germ cells (green circles). (B-C) Bright field microscopy of RES mutant embryos and their corresponding phenotypically wild type sibling (WT), treated with PTU to avoid melanocyte production, in lateral view (C) or magnification (B, for rbmx2 and snip1). Increased levels of apoptosis, predominantly in the head, are observed upon RES loss-of-function. (scale bar: 0.5mm at 48 hpf; 0.35mm at 32 hpf). (D) UCSC genome tracks showing mRNA levels of RES complex members at 2 cell and 48 hpf stages. (E) RT-qPCR showing p53 mRNA levels. Error bars represent SD of the mean from two independent biological replicates (n = 10 embryos per biological replicate). A p53 up-regulation in the mutants compared to phenotypically WT siblings correlates with the increased cell dead observed in the brain. (F) In situ hybridization showing RES components sense (top) and antisense (bottom) probes. Lack of expression in the sense probes show the specifity of the RES expression pattern in the zebrafish developing embryos.