
|
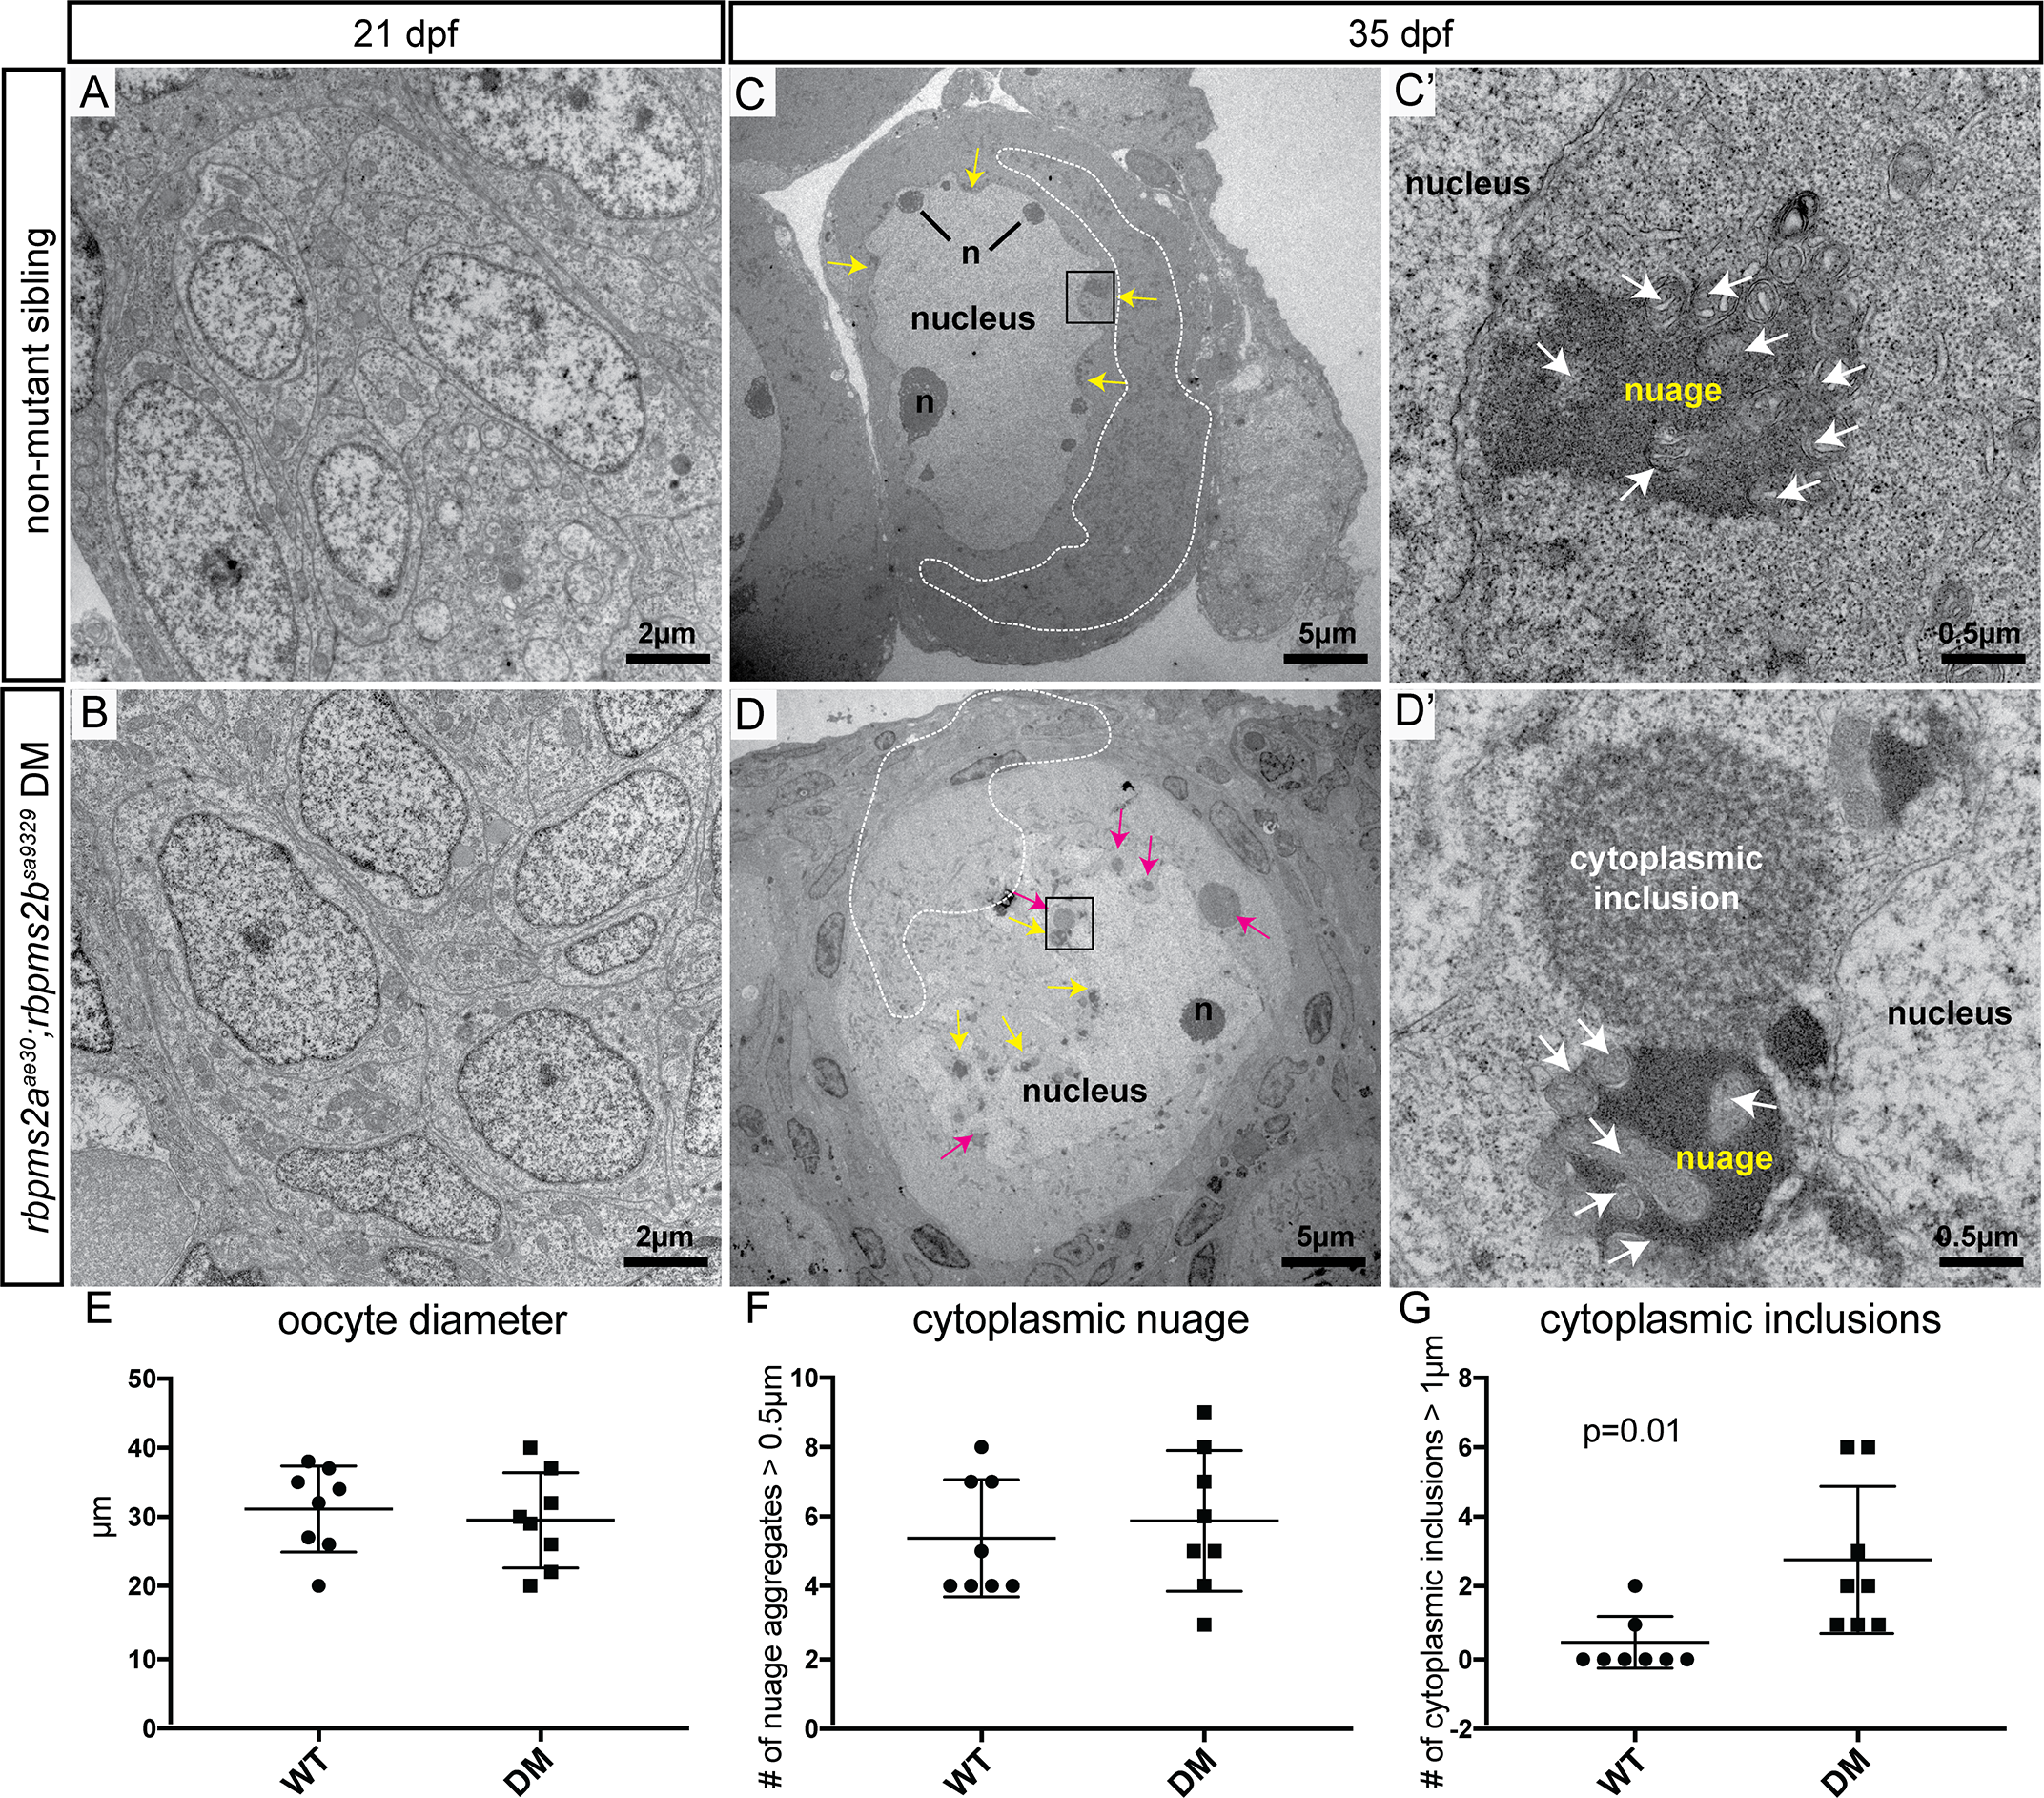
Fig. 9
rbpms2 mutant oocytes contain atypical cytoplasmic inclusions.
(A-B) Comparable clusters of gonocytes from d21 non-mutant siblings (A), and rbpms2 double mutants (B). (C,D) Oocytes from d35 non-mutant siblings (C), and rbpms2 double mutants (D). Marked features include: n = nucleoli, white dotted line outlining areas of mitochondrial enrichment, yellow arrows indicating nuage accumulations, pink arrows indicating atypical cytoplasmic inclusions. Areas marked in a black box in (C, D) are magnified in (C’,D’). (C’, D’) High magnification images of nuage with associated mitochondria (white arrows) in non-mutant oocyte (C’), and juxtaposed nuage and atypical cytoplasmic inclusion in rbpms2 mutant oocyte (D’). (E-G) Oocytes of comparable diameter (E) were used to quantify and compare number of nuage aggregates over 0.5μm (F), and number of cytoplasmic inclusions figover 1μm (G). Significance was analyzed with unpaired t-test.