
|
Fig. 2
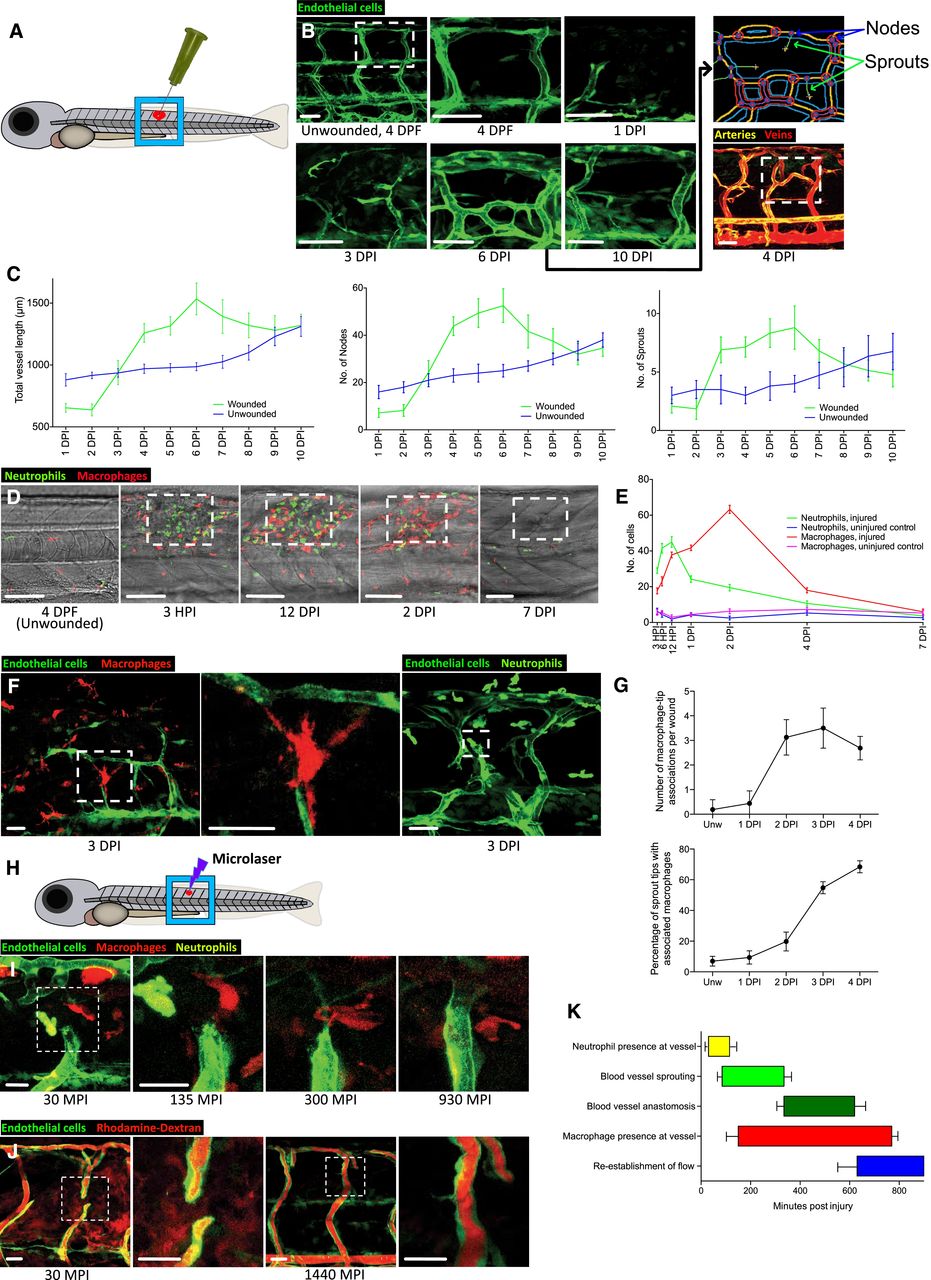
Macrophages are associated with blood vessel sprouting tips in zebrafish wounds
Lateral schematic of the larger, 30‐gauge needle‐stick fish wounds made to the flank of larval zebrafish at 4 days post‐fertilisation (DPF).
Representative confocal projection images of a wounded Tg(fli:GFP) zebrafish, showing the typical time course of blood vessel infiltration over 10 days post‐injury following needle‐stick injury as per (A). Boxed area denotes site of wounding. The Macrophages are associated with blood vessel sprouting tips in zebrafish woundsAngioanalyser node/sprout quantification (see Materials and Methods) is generated for the entire area of interest and is visually indicated via the output from processing the 6 DPI image, showing nodes as red circles and sprouts as green lines. Representative confocal projection of a wounded Tg(dll4:GFP); Tg(kdrl: mCherry‐CAAX) zebrafish, showing veins (red) and arteries (yellow), demonstrating a contribution to wound vasculature from both lineages with formation of chimeric vessels at the wound site.
Graphical representation of total vessel length, number of nodes and sprouts throughout the period of needle‐stick wound repair as represented in (B), plotted against vessel measurements from uninjured fish. N = 12 independent fish per timepoint per condition (unwounded versus wounded).
Representative confocal projection images of Tg(mpeg:mCherry); Tg(mpx:GFP) transgenic zebrafish, showing time course of macrophage (red) and neutrophil (green) migration to needle‐stick wounds as per (A), 0‐7 DPI. Boxed area denotes site of wounding.
Quantification of macrophage and neutrophil numbers at the wound site versus uninjured tissue, measured from time course represented in (D). N = 12 independent fish per timepoint, per condition.
Representative confocal projection image of Tg(fli:GFP); Tg(mpeg:mCherry) or Tg(fli:GFP); Tg(mpx:GFP) transgenic zebrafish at 3 DPI, showing typical immune cell–blood vessel sprout interactions following needle‐stick injury. Boxed area denotes site of immune cell–endothelial cell interaction.
Quantification of macrophage–blood vessel sprout association throughout early stages of repair, measured from time course represented in (F). N = 16 independent fish per timepoint.
Lateral schematic of smaller microlaser wound, performed on 4 DPF zebrafish.
Representative confocal projection images taken from timelapse movies of a laser injured Tg(fli:GFP); Tg(mpx:GFP); Tg(mpeg:mCherry) transgenic zebrafish, 4 DPF, imaged at 30–930 MPI. Neutrophils appear at the wound site early and transiently; macrophages appear at approximately the same time as blood vessel sprouting commences and remain associated with the repairing blood vessels throughout sprouting and anastomosis. Boxed area denotes wound site.
Representative confocal projection images taken of laser wounded Tg(fli:GFP) transgenic zebrafish injected with high molecular weight dextran (red) immediately before imaging. This “angiography” technique reveals how wound blood vessels are initially leaky, but that patency is restored once the vessel is repaired and lumenised. Boxed area denotes wound site. N = 12 independent fish per timepoint.
Graphical temporal representation of common cellular interaction events, measured from movies represented in (I). N = 7 independent fish.