
|
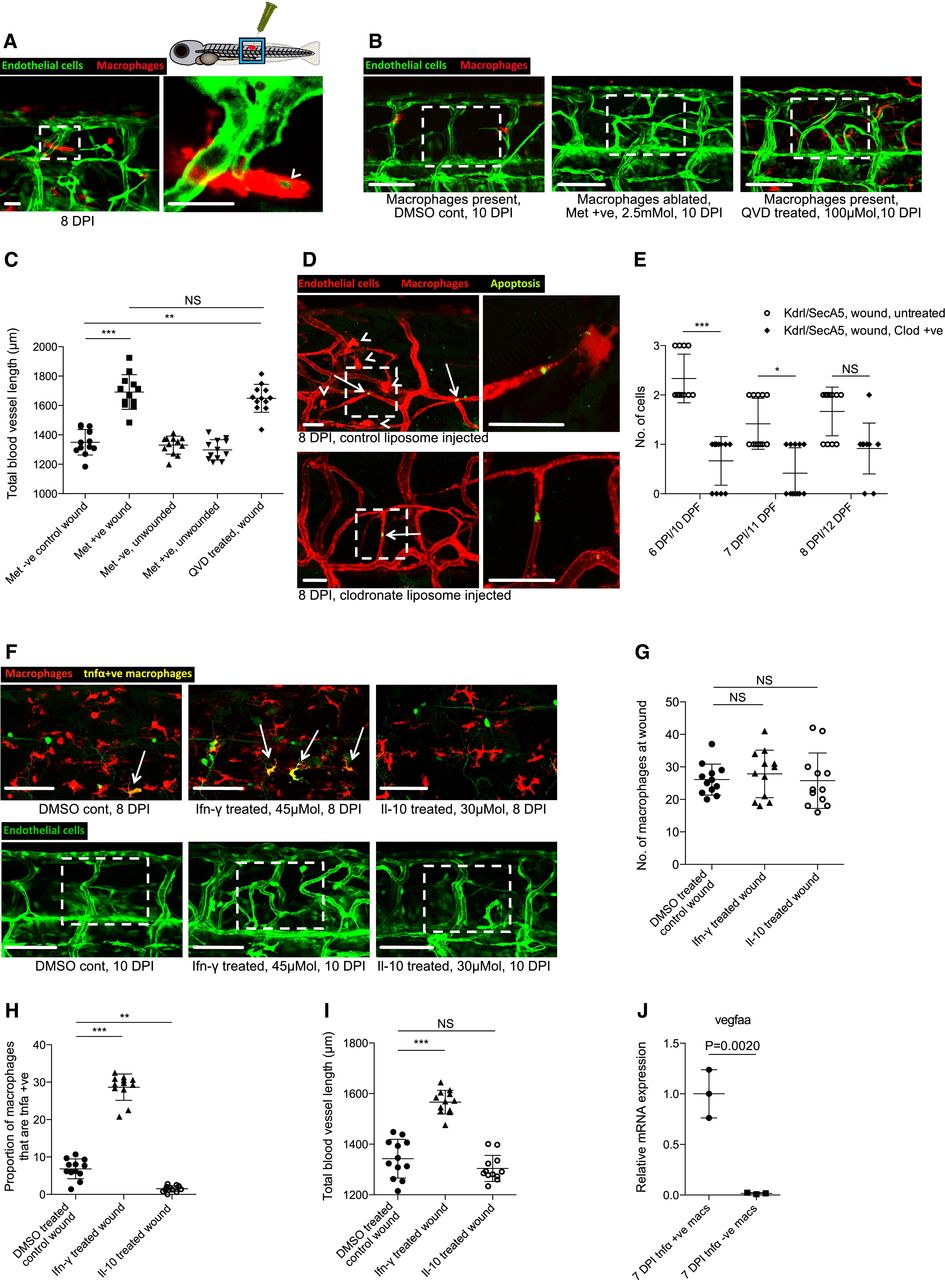
Fig. 7
Macrophages mediate blood vessel regression, dependent on phenotypic status
Representative confocal projection images taken from needle‐stick wounded Tg(fli:GFP); Tg(mpeg:mCherry), double‐transgenic zebrafish, imaged at 7 DPI. Some macrophages at this later wound repair timepoint contain phagocytosed GFP tagged endothelial material (arrowhead). Boxed area denotes macrophage containing endothelial cell material. N = 9 independent fish.
Representative confocal projection images taken from needle‐stick wounded Tg(fli:GFP); Tg(mpeg:KalTA4); Tg(UAS:nfsB‐mCherry) triple transgenic zebrafish, imaged at 10 DPI, treated with vehicle control, metronidazole or QVD pan‐caspase inhibitor from 6 DPI. Both macrophage ablation and caspase blockade resulted in a failure to remodel vessels. Boxed area denotes wound site.
Quantification of total blood vessel length, measured from images represented in (B). N = 12 independent fish per timepoint per condition. Statistical significance, as determined by one‐way ANOVA, is P ≤ 0.0001.
Representative confocal projection images taken from needle‐stick wounded Tg(kdrl:mCherry‐CAAX); Tg(secA5‐YFP); Tg(mpeg:mCherry) transgenic zebrafish, imaged at 8 DPI, injected with control liposomes or clodronate liposomes as indicated. Macrophages are observed within the wound site in control liposome‐treated fish (arrowheads). The apoptotic marker is seen in thin, unicellular tubes during the regression phase (arrows). Ablation of macrophages during the regression phase results in decreased levels of vessel apoptosis.
Quantification of apoptotic endothelial cells during vessel regression, measured from images represented in (D). N = 12 independent fish per timepoint per condition. Statistical significance, as determined by one‐way ANOVA, is P ≤ 0.0001.
Representative confocal projection images taken from either 8 DPI Tg(mpeg:mCherry); Tg(tnfα:GFP) transgenic fish or 10 DPI Tg(fli:GFP) transgenic fish, treated as indicated from 6 DPI, following needle‐stick injury. Inflammatory tnfα‐positive macrophages are indicated (arrows). Boxed area denotes wound site.
Quantification of number of macrophages at the wound site at 8 DPI, measured from images represented in (F). N = 12 independent fish per timepoint per condition. Statistical significance, as determined by one‐way ANOVA, is P = 0.7412 (not significant).
Quantification of proportion of macrophages that are tnfα‐positive inflammatory macrophages at the wound site at 8 DPI, measured from images represented in (F). N = 12 independent fish per timepoint per condition. Statistical significance, as determined by one‐way ANOVA, is P ≤ 0.0001.
Quantification of total blood vessel length at 10 DPI, measured from images represented in (F) using Angioanalyser. N = 12 independent fish per timepoint per condition. Statistical significance, as determined by one‐way ANOVA, is P ≤ 0.0001.
Gene expression for FAC‐sorted Tg(mpeg:mCherry); Tg(tnfα:GFP) zebrafish wound macrophages extracted at 7 DPI following needle‐stick injury. tnfα‐positive inflammatory macrophages express higher levels of vegfaa than tnfα‐negative non‐inflammatory macrophages. N = 100 independent fish per condition, 3 replicates. Statistical significance is indicated, as determined by two‐tailed t‐test.