
|
Fig. 7-S1
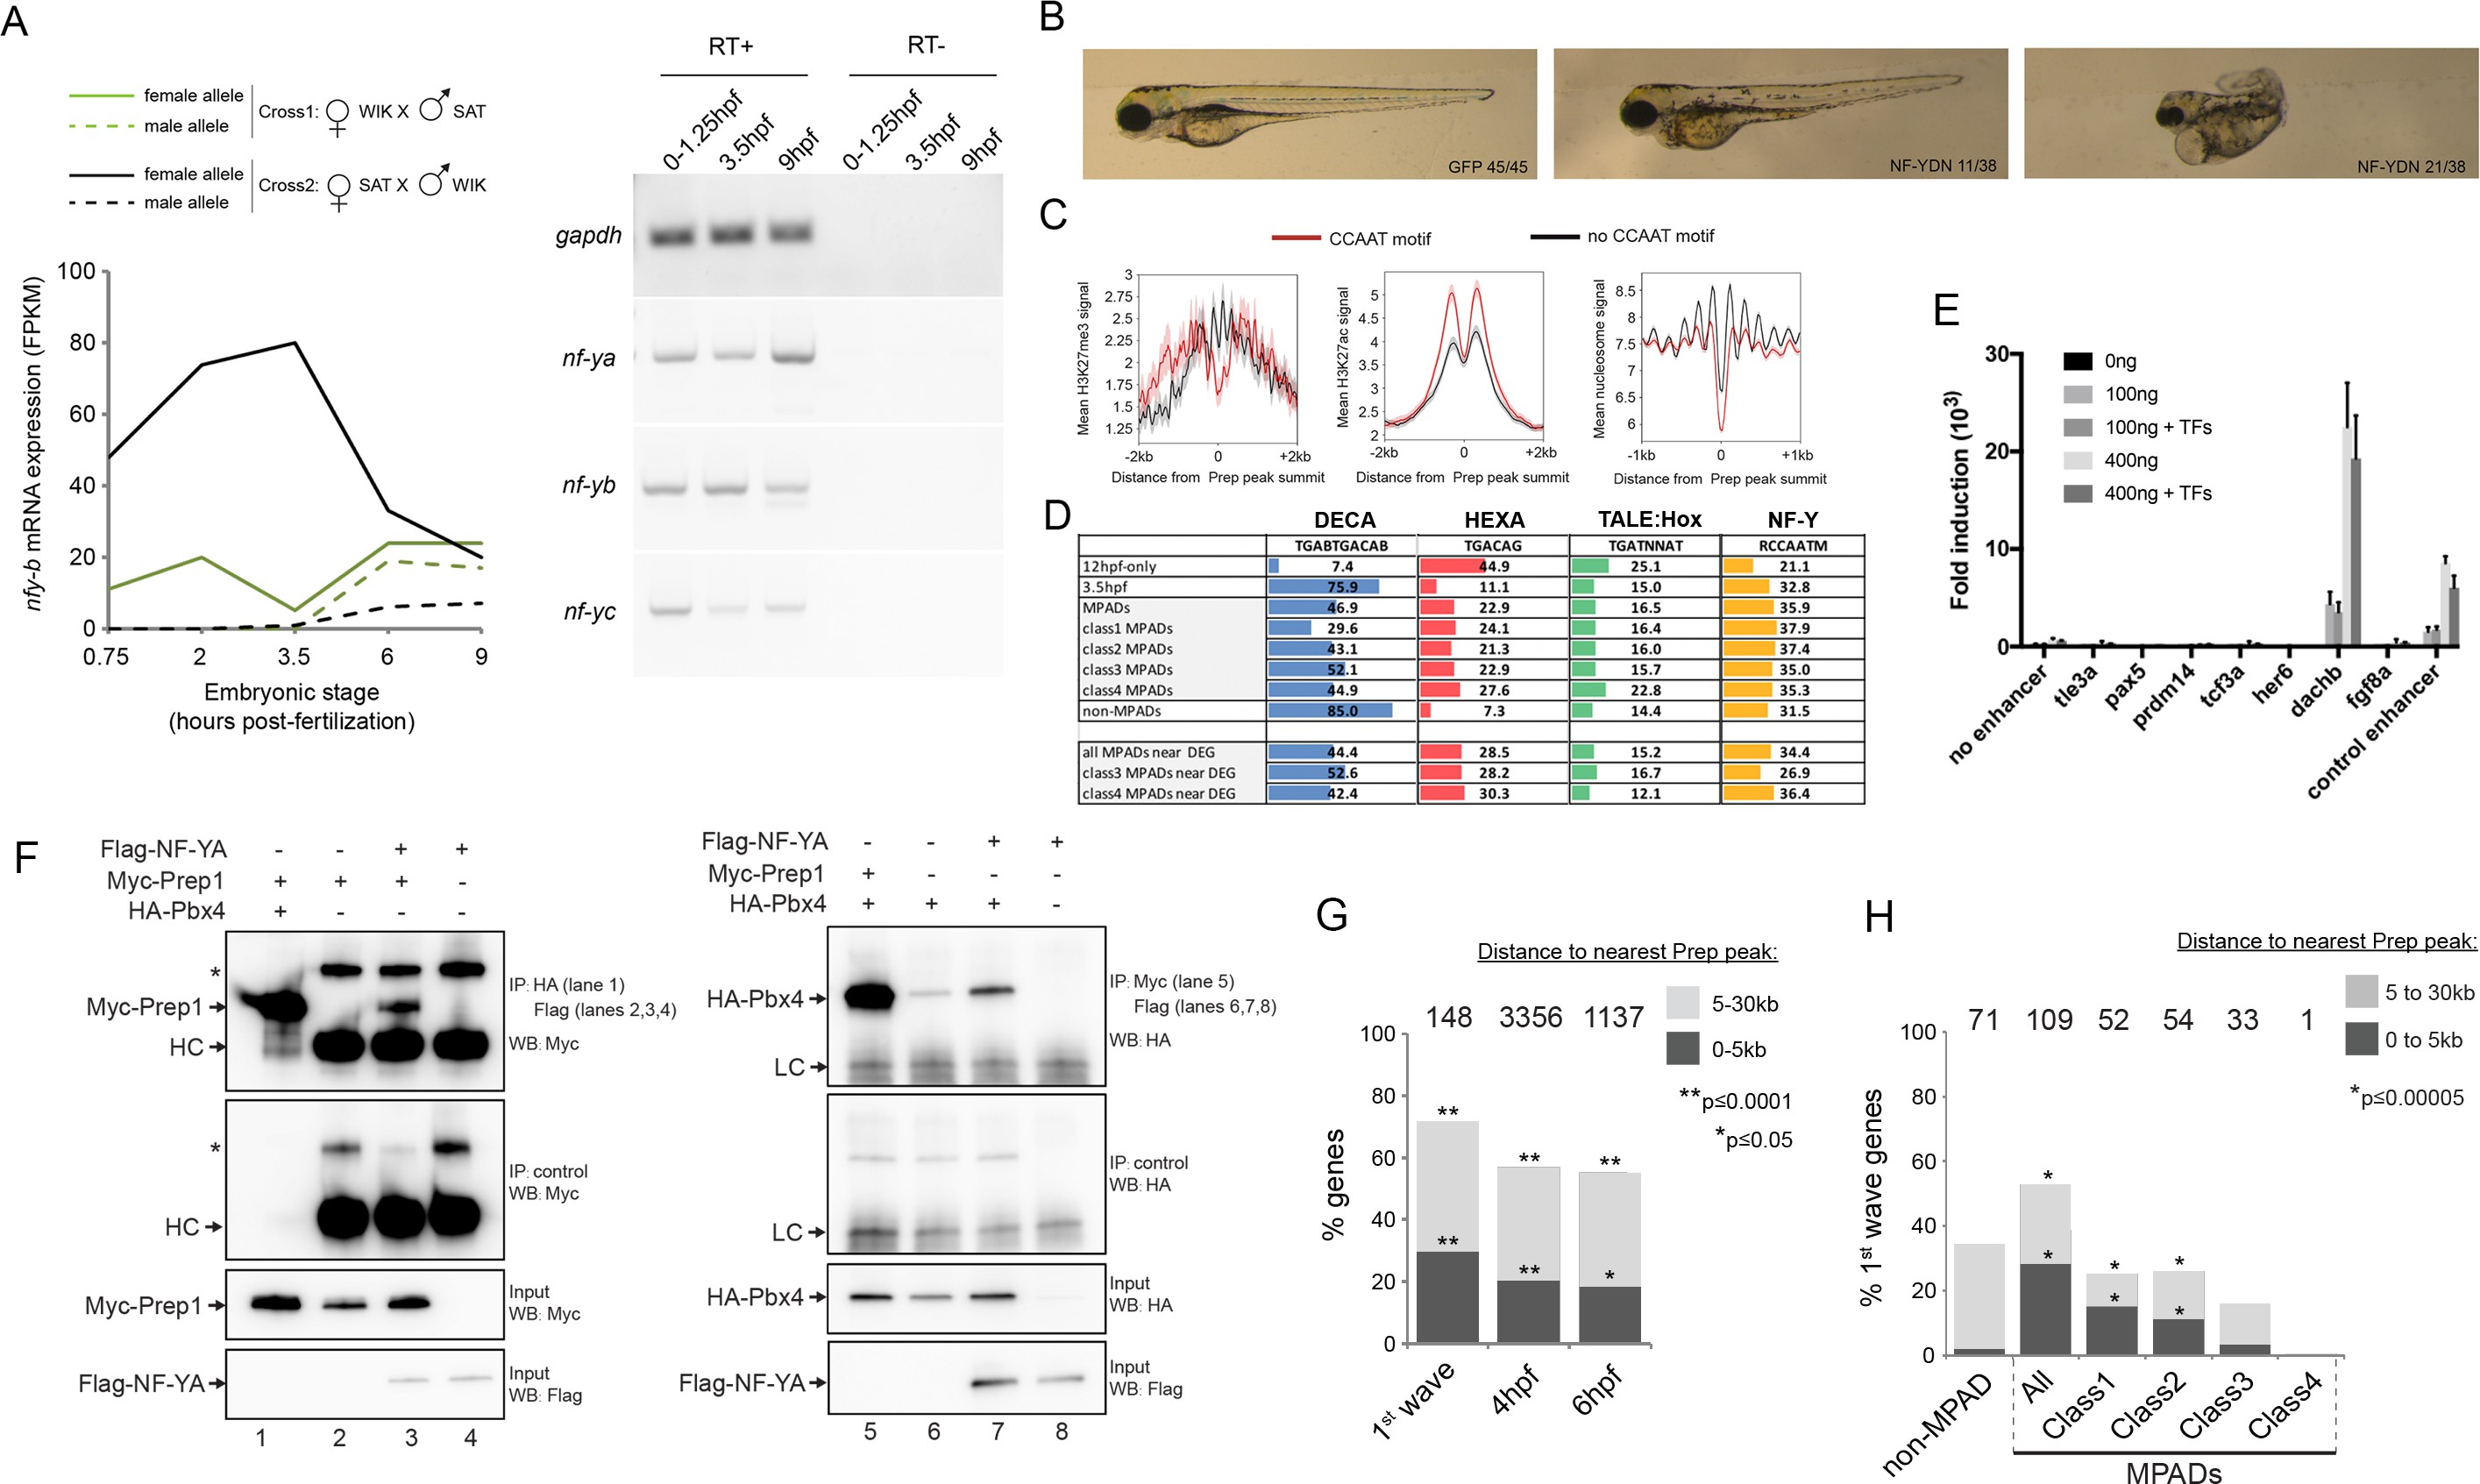
NF-Y TF regulates anterior embryonic structures and interacts with Prep and Pbx.
(A) Left panel: Expression levels of maternal and paternal nf-yb transcripts during early zebrafish embryogenesis (using data from [Harvey et al., 2013]). At 3.5hpf, transcripts from the paternal allele (which requires zygotic activation) are not detected, demonstrating that only maternal nf-yb transcripts are present at this time point. Right panel: RT-PCR analysis on 0–1.25hpf, 3.5hpf and 9hpf zebrafish embryos demonstrating that nf-ya, nf-yb and nf-yc transcripts are maternally deposited. (B) Images of 4 dpf zebrafish following injection with mRNA encoding a NF-Y dominant negative construct (NFY-DN). Control gfp mRNA injected fish show normal wild type morphology, while 21/38 and 11/38 NF-YDN injected fish have severe or mild developmental defects, respectively. Six NF-YDN injected embryos died. Note that some developmental defects are shared with TALE KD injected embryos; for example smaller head, eyes and cardiac edema (see Figure 1—figure supplement 1A). (C) Average H3K27ac, H3K27me3 and nucleosome signal at TALE sites with (red line) or without (black line) adjacent NF-Y (CCAAT) motifs. (D) Distribution of the various binding motifs (DECA, HEXA, TALE:Hox, NF-Y) at 12hpf-only and 3.5hpf Prep-occupied sites (3.5hpf sites are further broken down into MPAD classes), as well as at Prep-occupied sites associated with TALE-GRN genes (DEG = differentially expressed genes identified by RNA-seq after TALE-KD). Numbers in boxes indicate percent of all sequences in each class that contain each of the motifs. (E) Reporter assays in HEK293 cells testing enhancer activity. Each element was tested in triplicate using two concentrations (100 and 400 ng) of reporter plasmid in the presence (+TF) or absence (-TF) of co-transfected TALE and NF-Y factors. Data is presented as mean ± SD fold induction over control plasmid. (F) Co-IP experiments showing interaction of Myc-Prep (left panels) and HA-Pbx4 (right panels) with Flag-NF-YA in transfected HEK293 cells. HC = Ig heavy chain. Asterisks indicate non-specific signal. (G) Localization of early zygotic genes (Lee et al., 2013) relative to Prep ChIP-seq peak summits. The number of genes within 30 kb of Prep binding sites is indicated above each bar. p-values for enrichment above a random set of genes were calculated using the Pearson correlation test. (H) Localization of first-wave zygotic genes relative to MPADs and non-MPADs. Numbers above bars indicate the number of genes within 30 kb of each type of Prep binding site. p-values for enrichment above a random set of genes were calculated using the Pearson correlation test.