
|
Fig. 1-S1
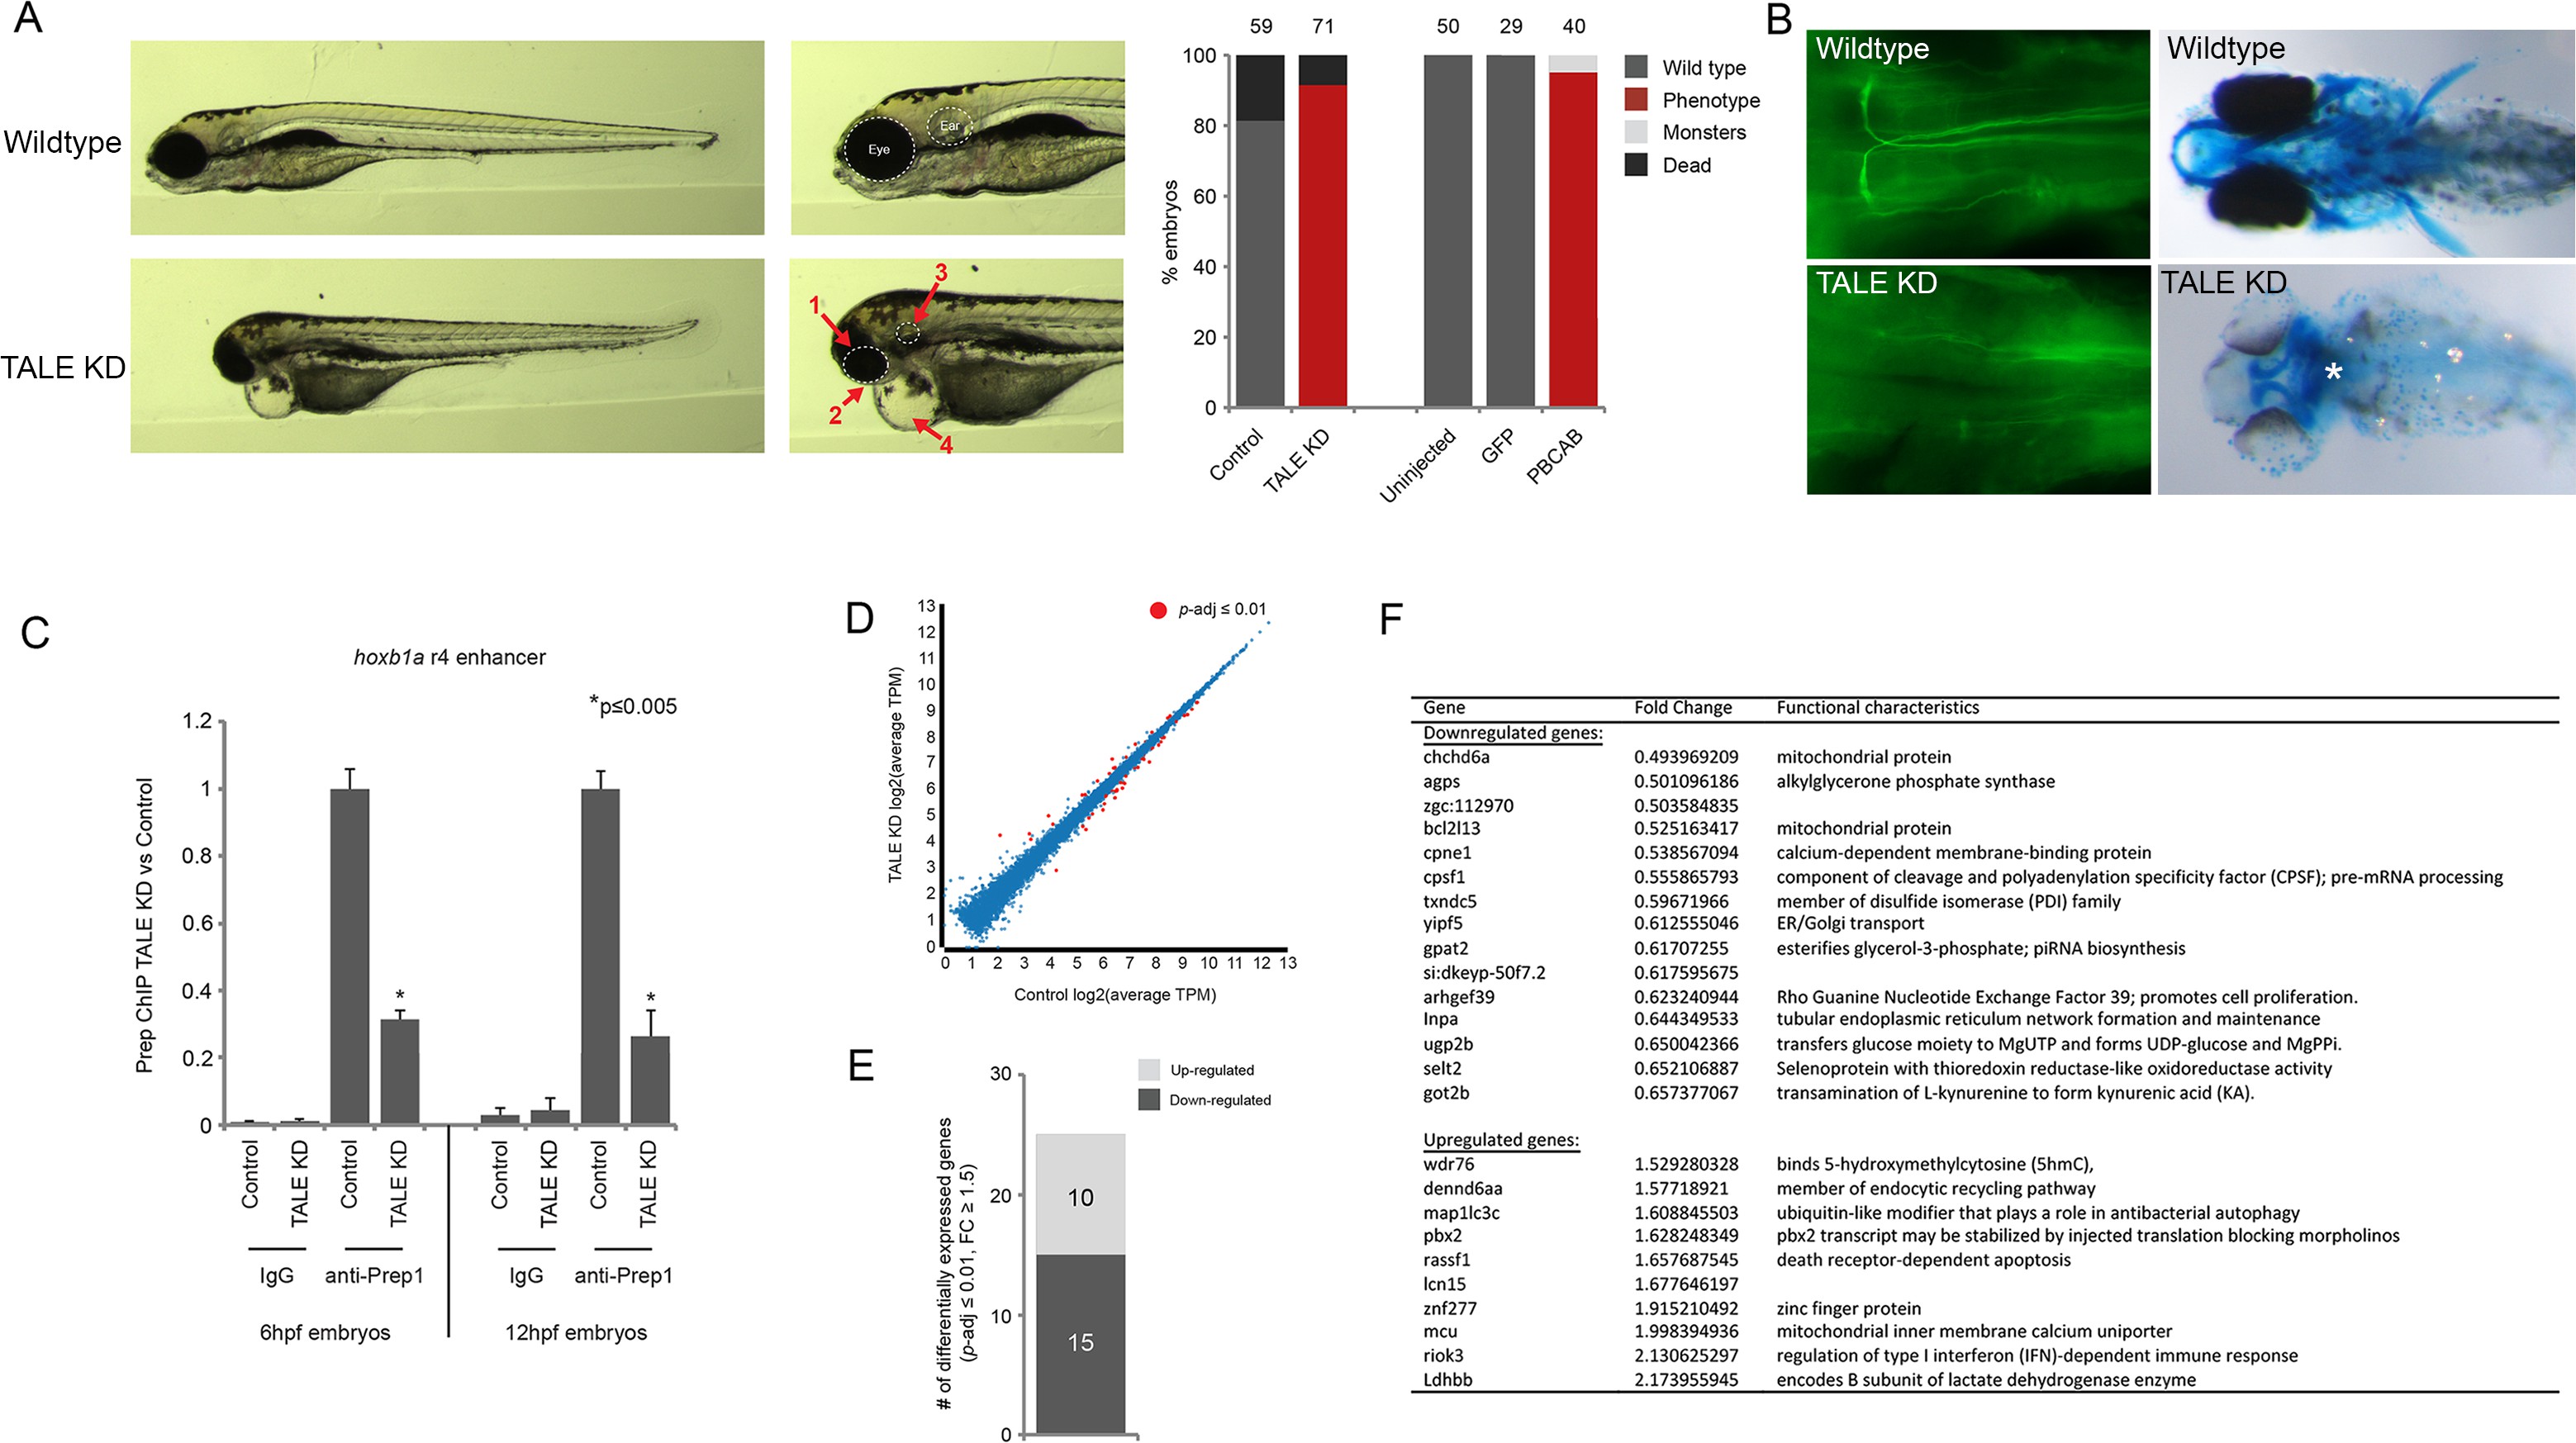
Characterization of the TALE KD phenotype.
(A) Left panels; images of 4 days post-fertilization (dpf) zebrafish following TALE knockdown (TALE KD). Middle panels; views of the anterior region at higher magnification. The TALE KD phenotype is characterized by an overall small head with under-developed eyes (1), jaw (2) and otic vesicles (3), as well as cardiac edema (4). Right bar graphs; quantification of the phenotype for TALE KD zebrafish and zebrafish injected with mRNA encoding a dominant negative TALE protein (PBCAB [Choe et al., 2009]). Note that both strategies for TALE disruption produce similar results, showing the specificity of the phenotype. Numbers above bars indicate the total number of embryos analyzed in each condition. (B) Left panels; wildtype (top) and TALE KD (bottom) 48hpf embryos stained with 3A10 antibody to detect hindbrain Mauthner neurons (images show only the hindbrain and are in dorsal view with anterior to the left). Right panels; wildtype (top) and TALE KD (bottom) 5dpf embryos stained with alcian blue to detect cartilage (images are ventral views with anterior to the left). Asterisk indicates loss of cartilage in TALE KD embryos. Also note the absence of pectoral fins in TALE KD embryos. (C) ChIP-qPCR showing Prep binding at the hoxb1a r4 enhancer in TALE KD vs control embryos at 6hpf and 12hpf. Note that TALE KD disrupts genomic Prep occupancy. Three independent biological replicates are presented as mean fold-change ± SEM of Prep IP in TALE KD vs control samples. Statistical test: unpaired t-test. (D) Scatter plot showing average TPM gene expression as identified by RNA-seq in TALE KD embryos vs control at 6hpf. Genes with significant expression variation (p-adj ≤0.01) are colored in red. Statistical test = Wald test in DeSeq2. (E) Graph showing the number of genes up/downregulated (p-adj ≤0.01, fold-change ≥1.5) in 6hpf TALE KD embryos vs control. (F) Table listing all genes up/downregulated at 6hpf in TALE KD embryos relative to control.