
Image
|
Figure Caption
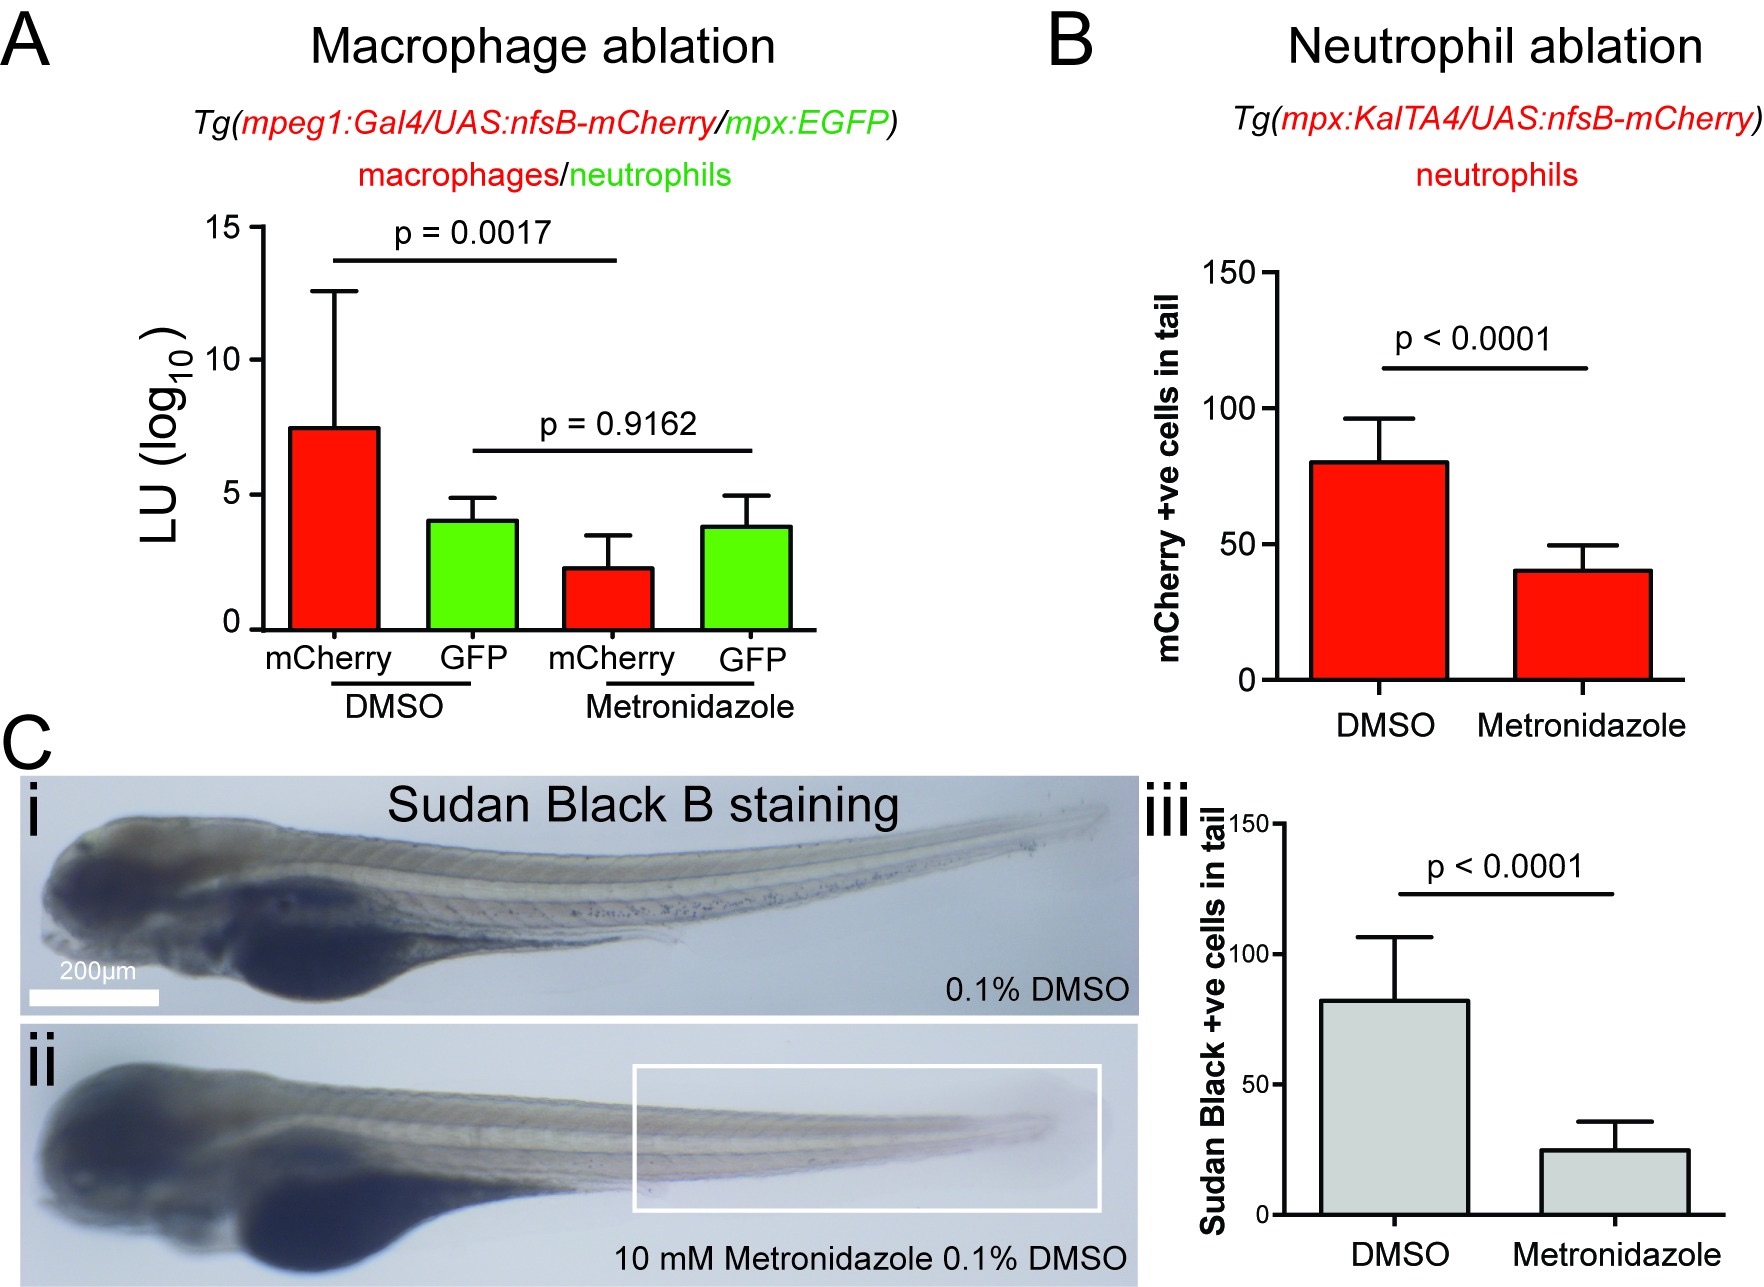
Fig. S9
- (A) Graph shows quantification of leukocyte units (LUs) for macrophages (NTR-mCherry, red bars) and neutrophils (GFP, green bars) in compound Tg(mpeg:Gal4/UAS:nfsB-mCherry/mpx:EGFP) transgenic zebrafish embryos treated with DMSO or Metronidazole. A significant reduction in NTR-expressing macrophages, but not neutrophils was observed in Metronidazole-treated embryos compared to DMSO-treated controls. Data are mean±SEM, n≥5 embryos/group/experiment, n≥3 experiments. Statistics: two-tailed t-test.
- (B) Counts of mCherry-positive cells in the tail region of Tg(mpx:KalTA4/UAS:nfsB-mCherry) transgenic embryos following treatment with DMSO or Metronidazole. A significant reduction in the number of mCherry-positive cells was observed. Data are mean±SD, n = 15 embryos/group pooled from N = 2 experiments. Statistics: two-tailed t-test.
- (C) Additional evidence for successful neutrophil ablation by Sudan Black B staining of embryos following DMSO (i) or Metronidazole (ii) treatment. Counts of Sudan Black positive cells in the tail region (iii) confirmed a significant reduction in Metronidazole-treated embryos. Data are mean±SD. N = 8 embryos from N = 1 experiment. Statistics: two-tailed t-test.
Quantification of nitroreductase-mediated leukocyte ablation.
Acknowledgments
This image is the copyrighted work of the attributed author or publisher, and
ZFIN has permission only to display this image to its users.
Additional permissions should be obtained from the applicable author or publisher of the image.
Full text @ PLoS Pathog.