
|
Fig. S1
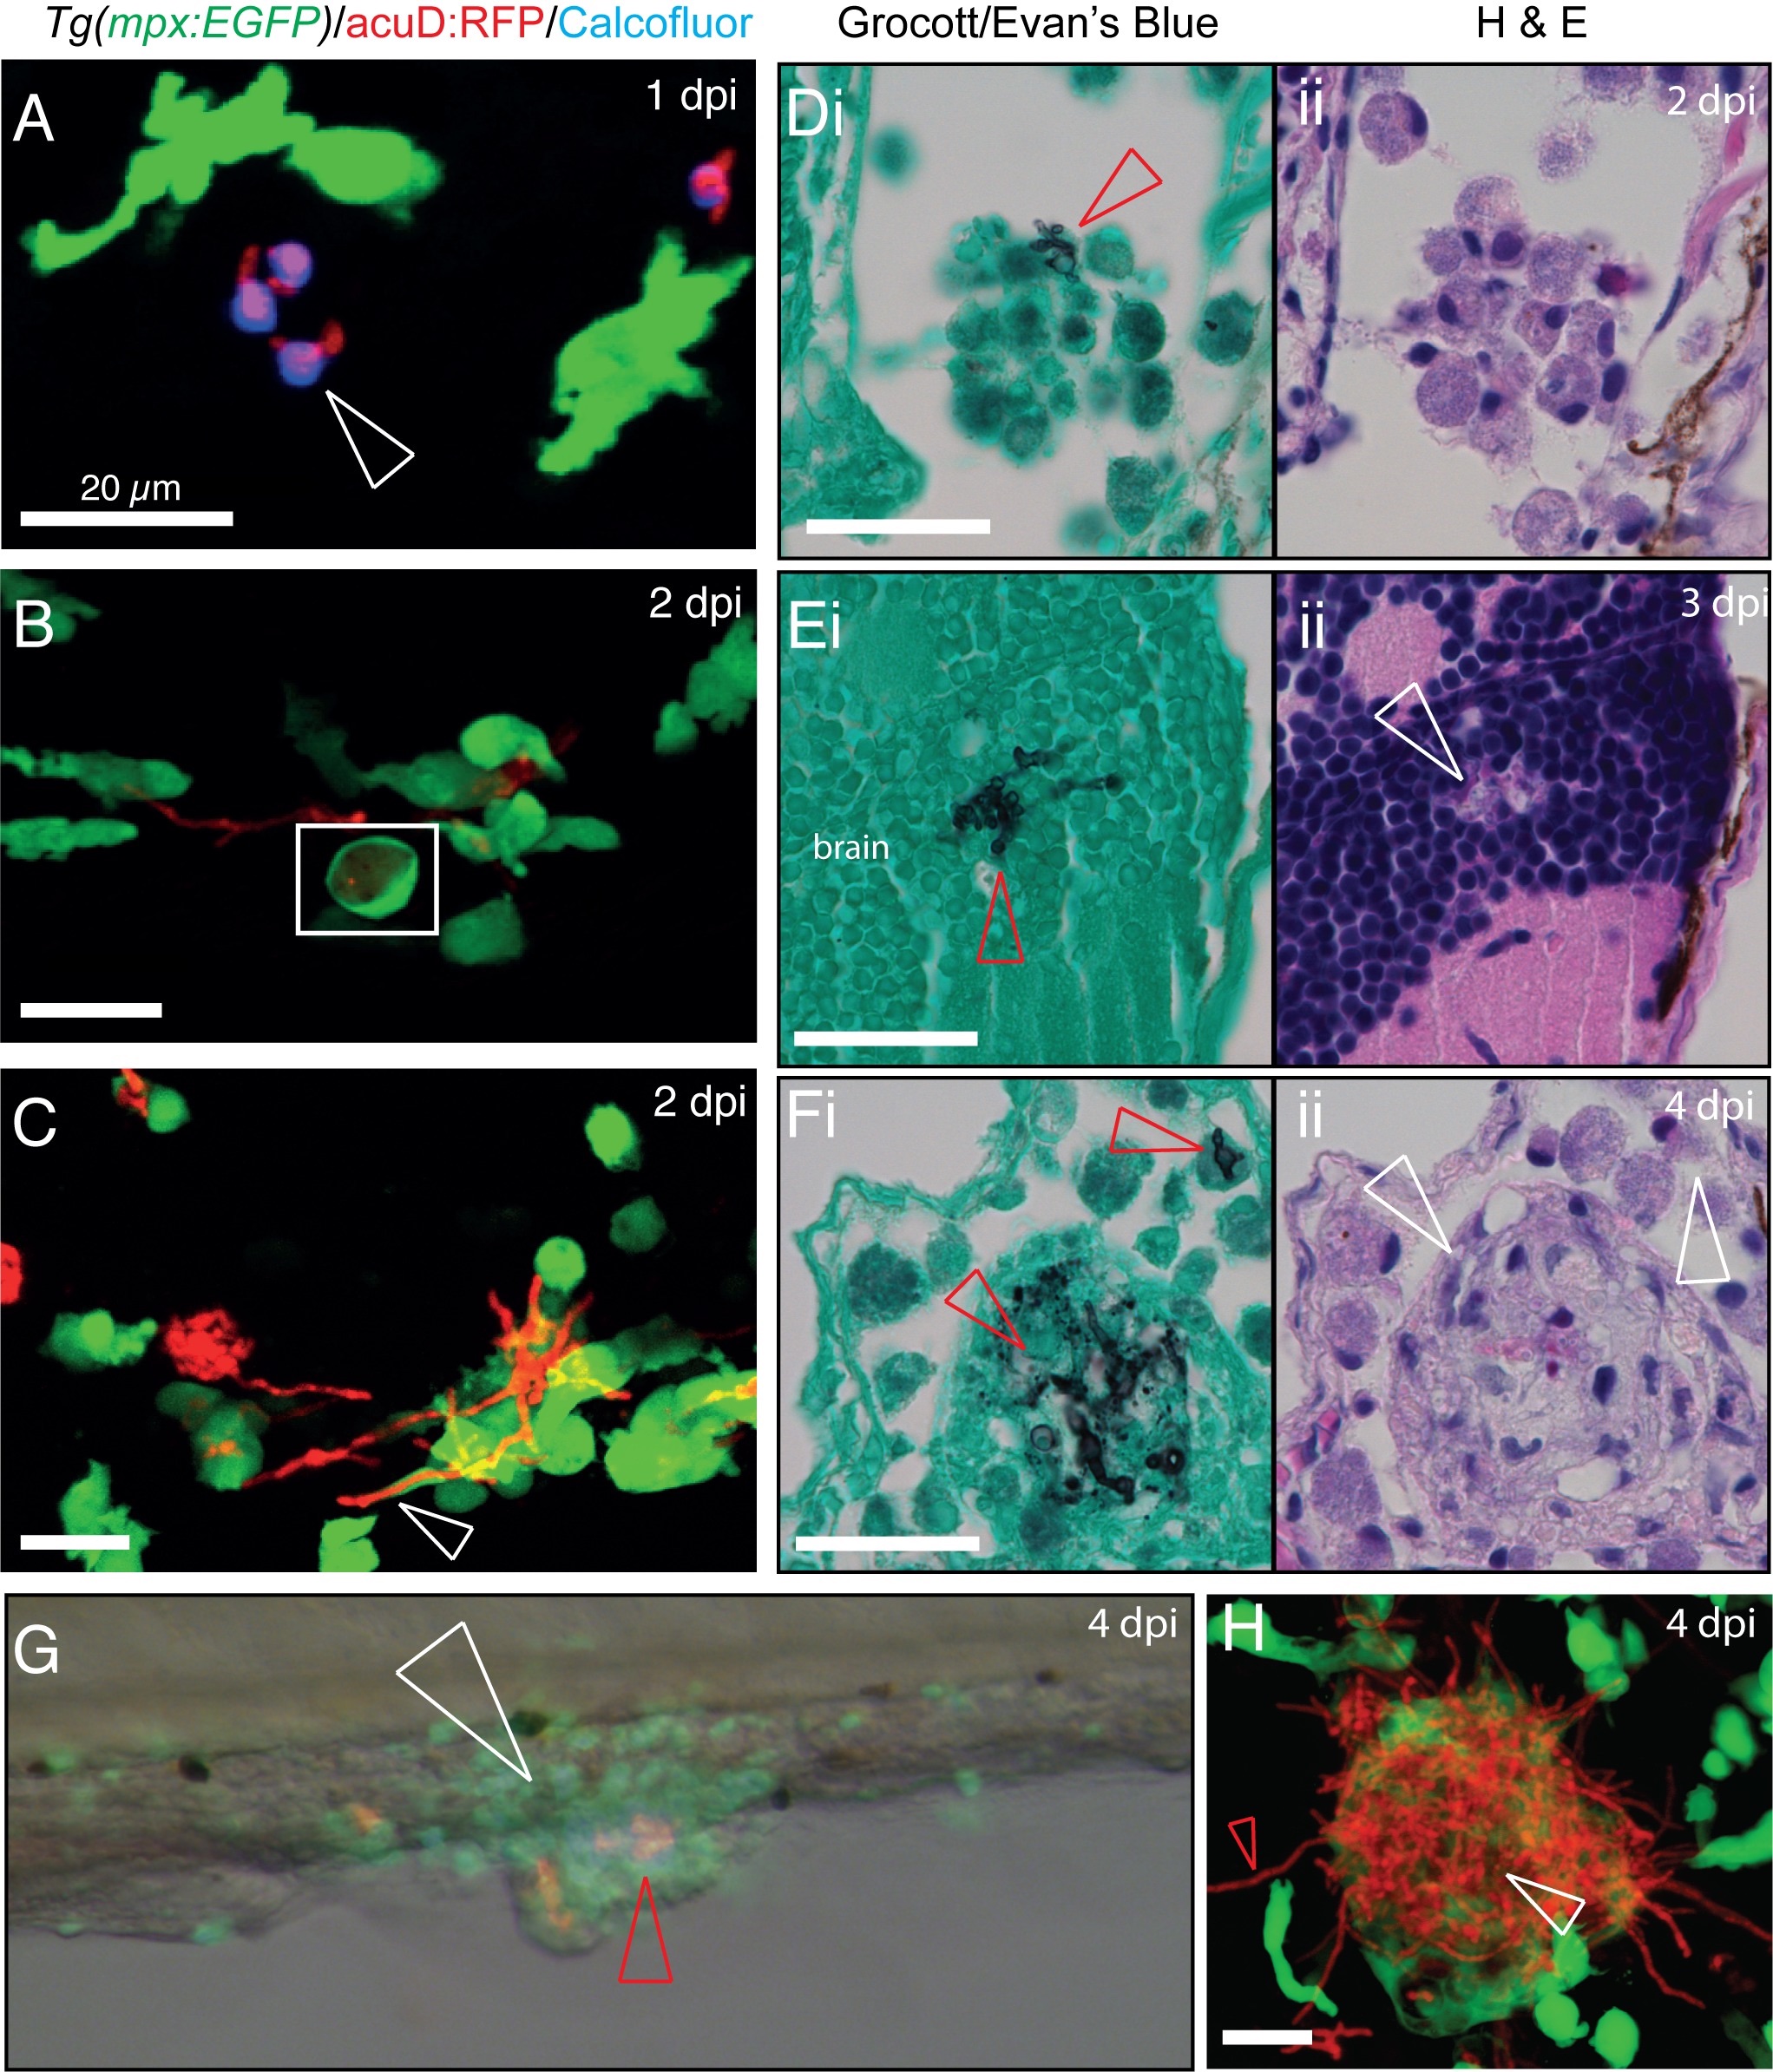
Additional features of zebrafish T. marneffei infection at 28°C.
(A-C) Maximum intensity projection confocal fluorescence z-stacks depicting stages of acuD:RFP T. marneffei infection in Tg(mpx:EGFP) zebrafish, allowing observation of fluorescent leukocytes, with calcofluor pre-staining allowing visualization of fungal conidia and RFP expression demonstrating their germination. Scale bars: 20 μm. dpi, days post infection.
(A) Germination of conidia at 1 dpi with extension of RFP-positive germ tubes from extracellular calcofluor-stained conidia (arrowhead) adjacent to Tg(mpx:EGFP) leukocytes.
(B) Destruction of fungal cells identified by RFP-positive debris within a neutrophil vacuole at 2 dpi (boxed).
(C) Filamentous fungal cell growth (arrowhead) stretches and ruptures some leukocytes at 2 dpi.
(D-F) Histology of infected zebrafish at different stages of T. marneffei infection. Fungal cells are stained black with Grocott’s methenamine silver stain against an Evan’s Blue counterstain (i, left panels). Tissues are visualized by hematoxylin and eosin staining of adjacent sections (ii, right panels). Scale bars: 20 μm.
(D) Early granuloma formation at 2 dpi with accumulation of leukocytes around an infection focus (red arrowhead).
(E) Infection focus in the brain at 3 dpi (red arrowhead).
(F) Organising granuloma at 4 dpi, with epithelioid leukocytes surrounding a necrotic centre containing fungal debris (lower red arrowhead). Infected leukocyte nearby (upper red arrowhead) suggests dissemination of infection from the granuloma by leukocytes.
(G) Low-power fluorescence image superimposed on brightfield image, showing granuloma formation at 4 dpi in tissue adjacent to the caudal hematopoietic tissue (CHT). Fluorescent Tg(mpx:EGFP) leukocytes (white arrowhead) have accumulated around a focus of germinated acuD:RFP T. marneffei cells (red arrowhead).
(H) Maximum intensity projection of confocal z-stack showing accumulation of EGFP positive leukocytes around a focus of RFP-expressing germinated T. marneffei. Invasive filamentous growth (red arrowhead) radiates from the margins of the granuloma centre (white arrowhead). Scale bar: 20 μm.
(TIF)