
|
Fig. 1
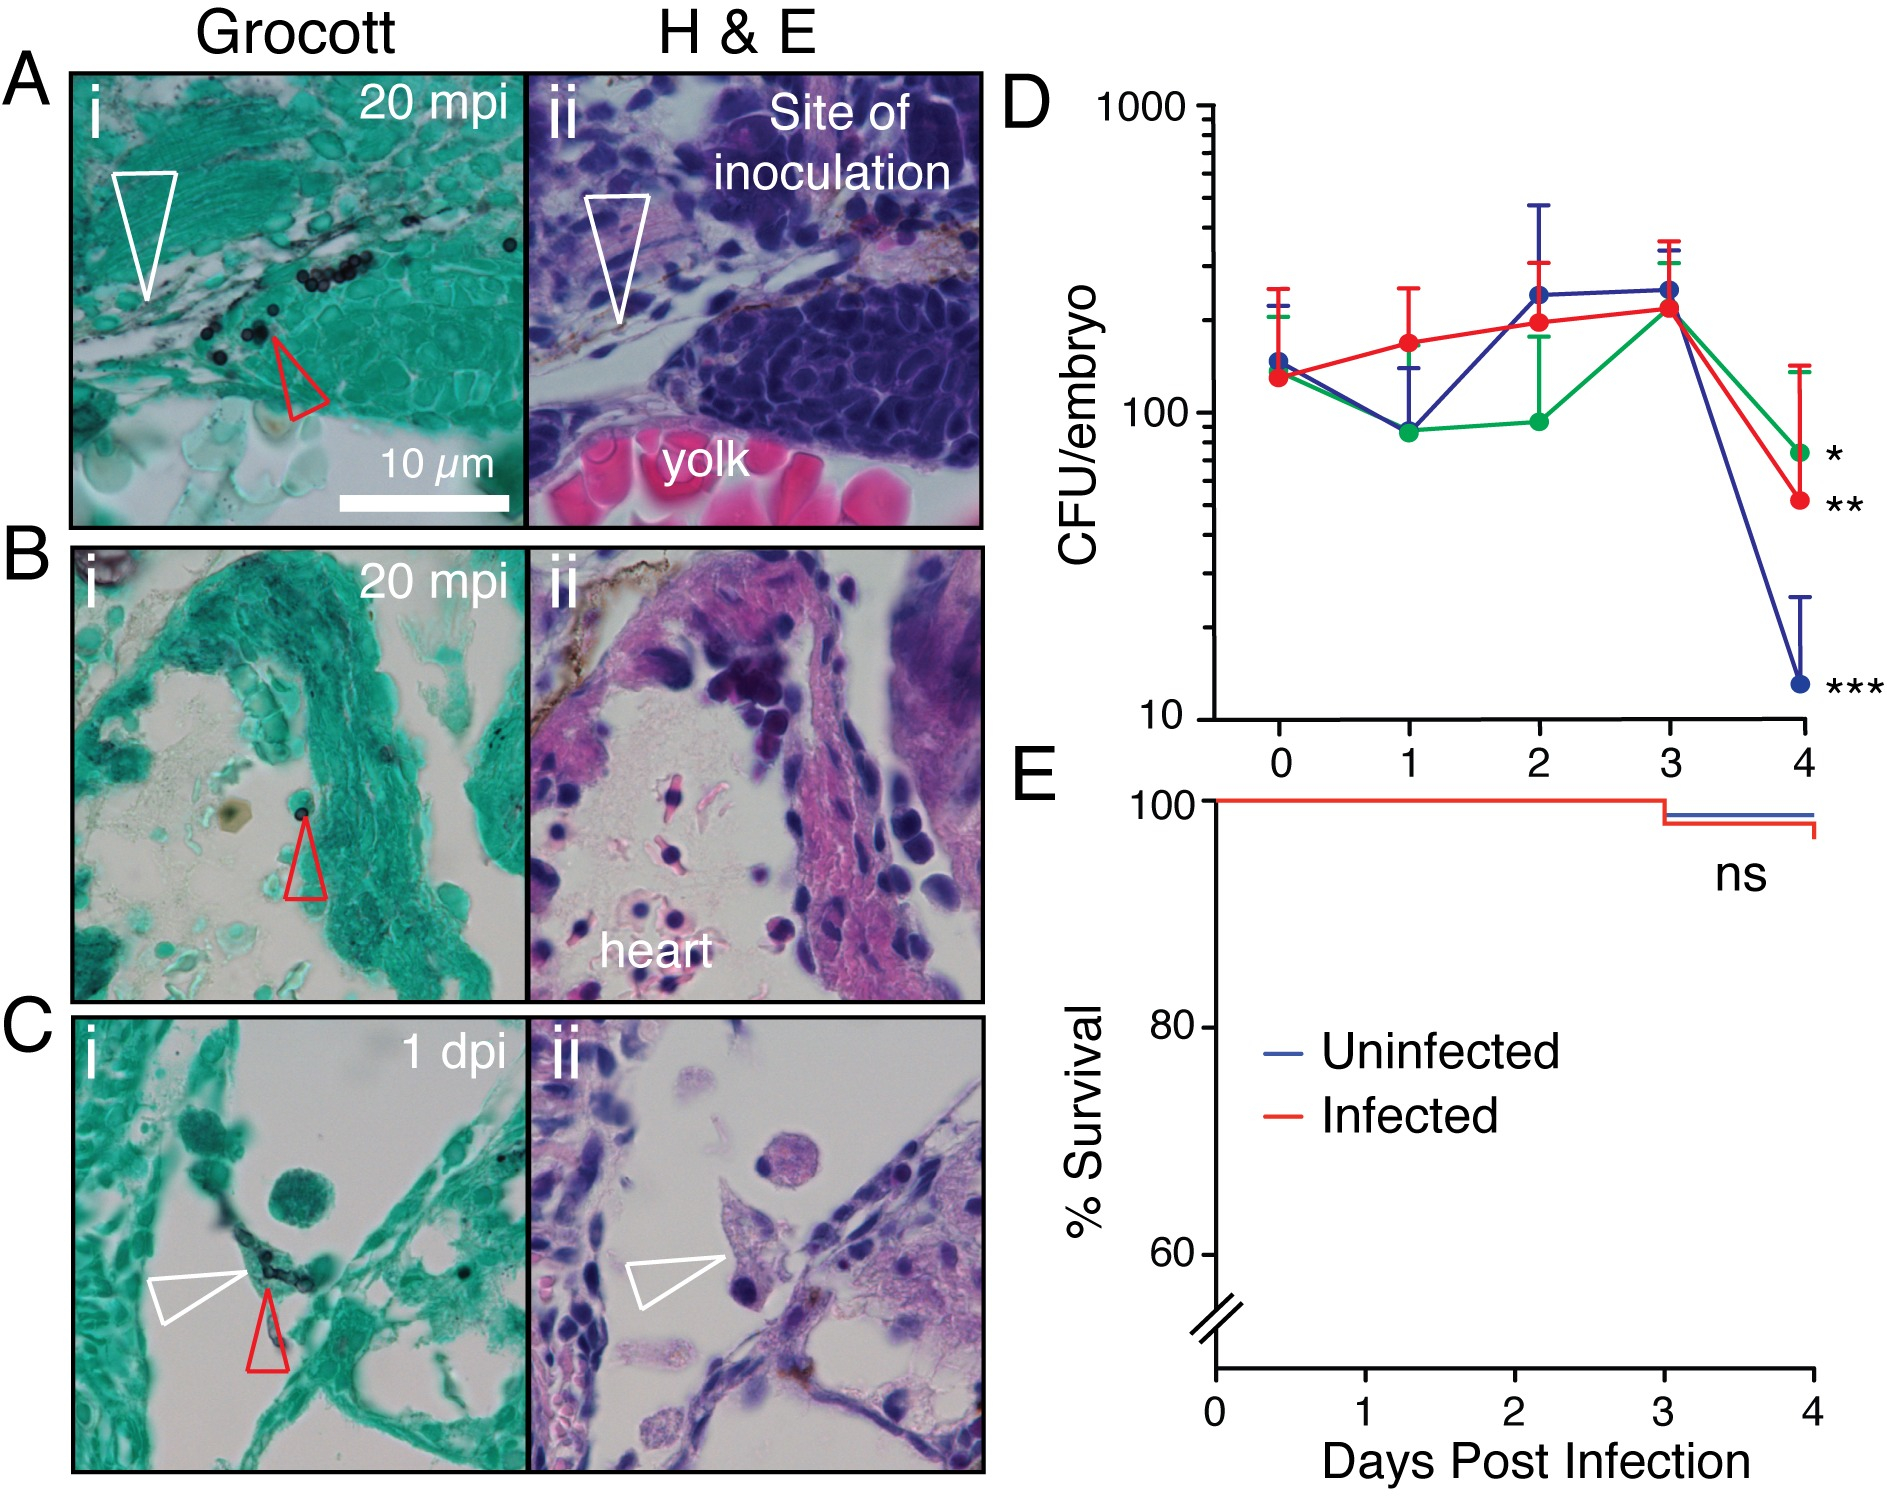
T. marneffei infection of zebrafish at 28°C.
(A-C) Histological time-course following T. marneffei inoculation of zebrafish, stained by Grocott methanamine silver and Evan’s Blue counterstain (i), with adjacent hematoxylin and eosin-stained sections (ii). mpi, minutes post infection; dpi, days post infection. Red arrowheads indicate fungal conidia. White arrowheads indicate Duct of Cuvier (A) and leukocyte with intracellular fungal elements (C). (D) T. marneffei CFU time-course at 28°C following intravascular inoculation of target dose of approximately 150 fungal conidia (actual dose verified by 0 dpi CFU). Different colors indicate 3 independent experiments, mean±SEM, n≥5 embryos/group/experiment. *p = 0.016, **p = 0.0059, ***p = 0.0003 for statistical comparison between 3 and 4 dpi. (E) Embryo survival following intravascular inoculation in (D). Data are pooled embryos from 3 experiments: n = 474 uninfected, 339 infected. NS: not significant.