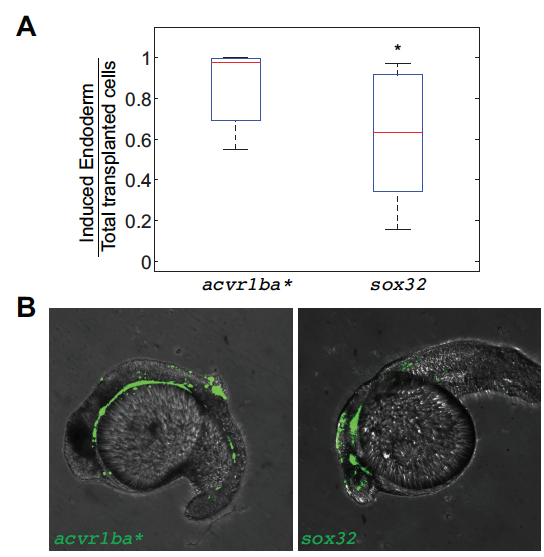
IMAGE

Fig. S6

ID
ZDB-IMAGE-181017-8
Source
Figures for Liu et al., 2018
Image
Figure Caption

Fig. S6

Induced endodermal cells internalize following transplantation to the margin. (A) Boxplot quantification of endoderm contribution of transplanted cells at 18 hpf. Data is shown as mean ± SEM of independent transplantation experiments with 14 embryos per condition. Student’s t-test was performed. * p<0.05.

(B) Representative image showing distribution of transplanted cells depicted in (A) at 18 hpf. acvr1ba*-expressing cells localized to the endoderm-derived tissue (green). Cells overexpressing sox32 localize to both endoderm and ectoderm-derived tissue. Lateral view, anterior to the left.

Acknowledgments
This image is the copyrighted work of the attributed author or publisher, and ZFIN has permission only to display this image to its users. Additional permissions should be obtained from the applicable author or publisher of the image. Full text @ Development