
|
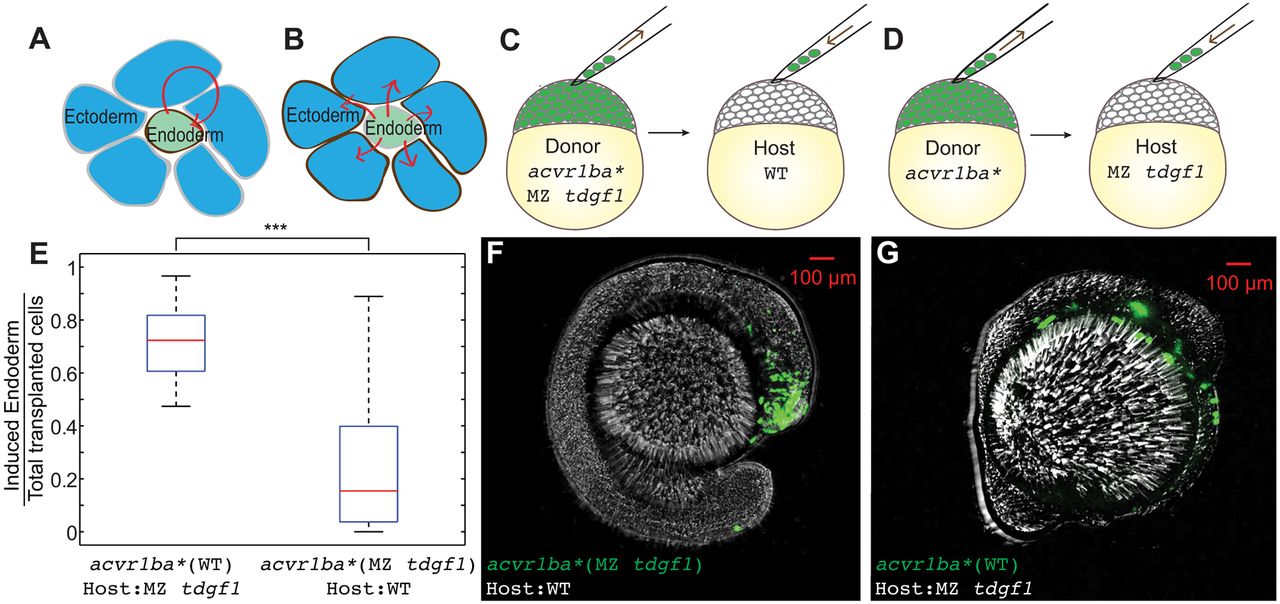
Fig. 4
Nodal ligand reception acts cell-autonomously to support sorting. (A,B) Schematics depicting autonomous (A) versus non-autonomous (B) Nodal ligand reception (red arrows). (C) Schematic depicting single donor transplant assay to test cell-autonomous Nodal signal reception. acvr1ba*-expressing cells from MZ tdgf1 donor embryos were transplanted to the animal pole of a wild-type (WT) host embryo. (D) Schematic depicting single donor transplant assay to test non-cell-autonomous Nodal signal reception. acvr1ba*-expressing cells from wild-type donor embryos were transplanted to the animal pole of a MZ tdgf1 host embryo. (E) Boxplot quantification of endoderm contribution at the 18-somite stage for all transplanted cells. Wild-type donor cells expressing acvr1ba* contributed to endodermal tissues whereas acvr1ba*-expressing cells from MZ tdgf1 embryos did not. Data are shown as mean±s.e.m. of two independent transplantation experiments, with 14 embryos per condition. ***P<0.001 (Student's t-test). (F) Representative image showing distribution of MZ tdgf1 cells expressing acvr1ba* in a wild-type host. Donor cells (green) localized to ectoderm-derived tissue, primarily the head. Lateral view, anterior to the right. (G) Representative image showing distribution of wild-type cells expressing acvr1ba* in a MZ tdgf1 host. Donor cells (green) localized to endoderm-derived tissue. Lateral view, anterior to the right.