
Image
|
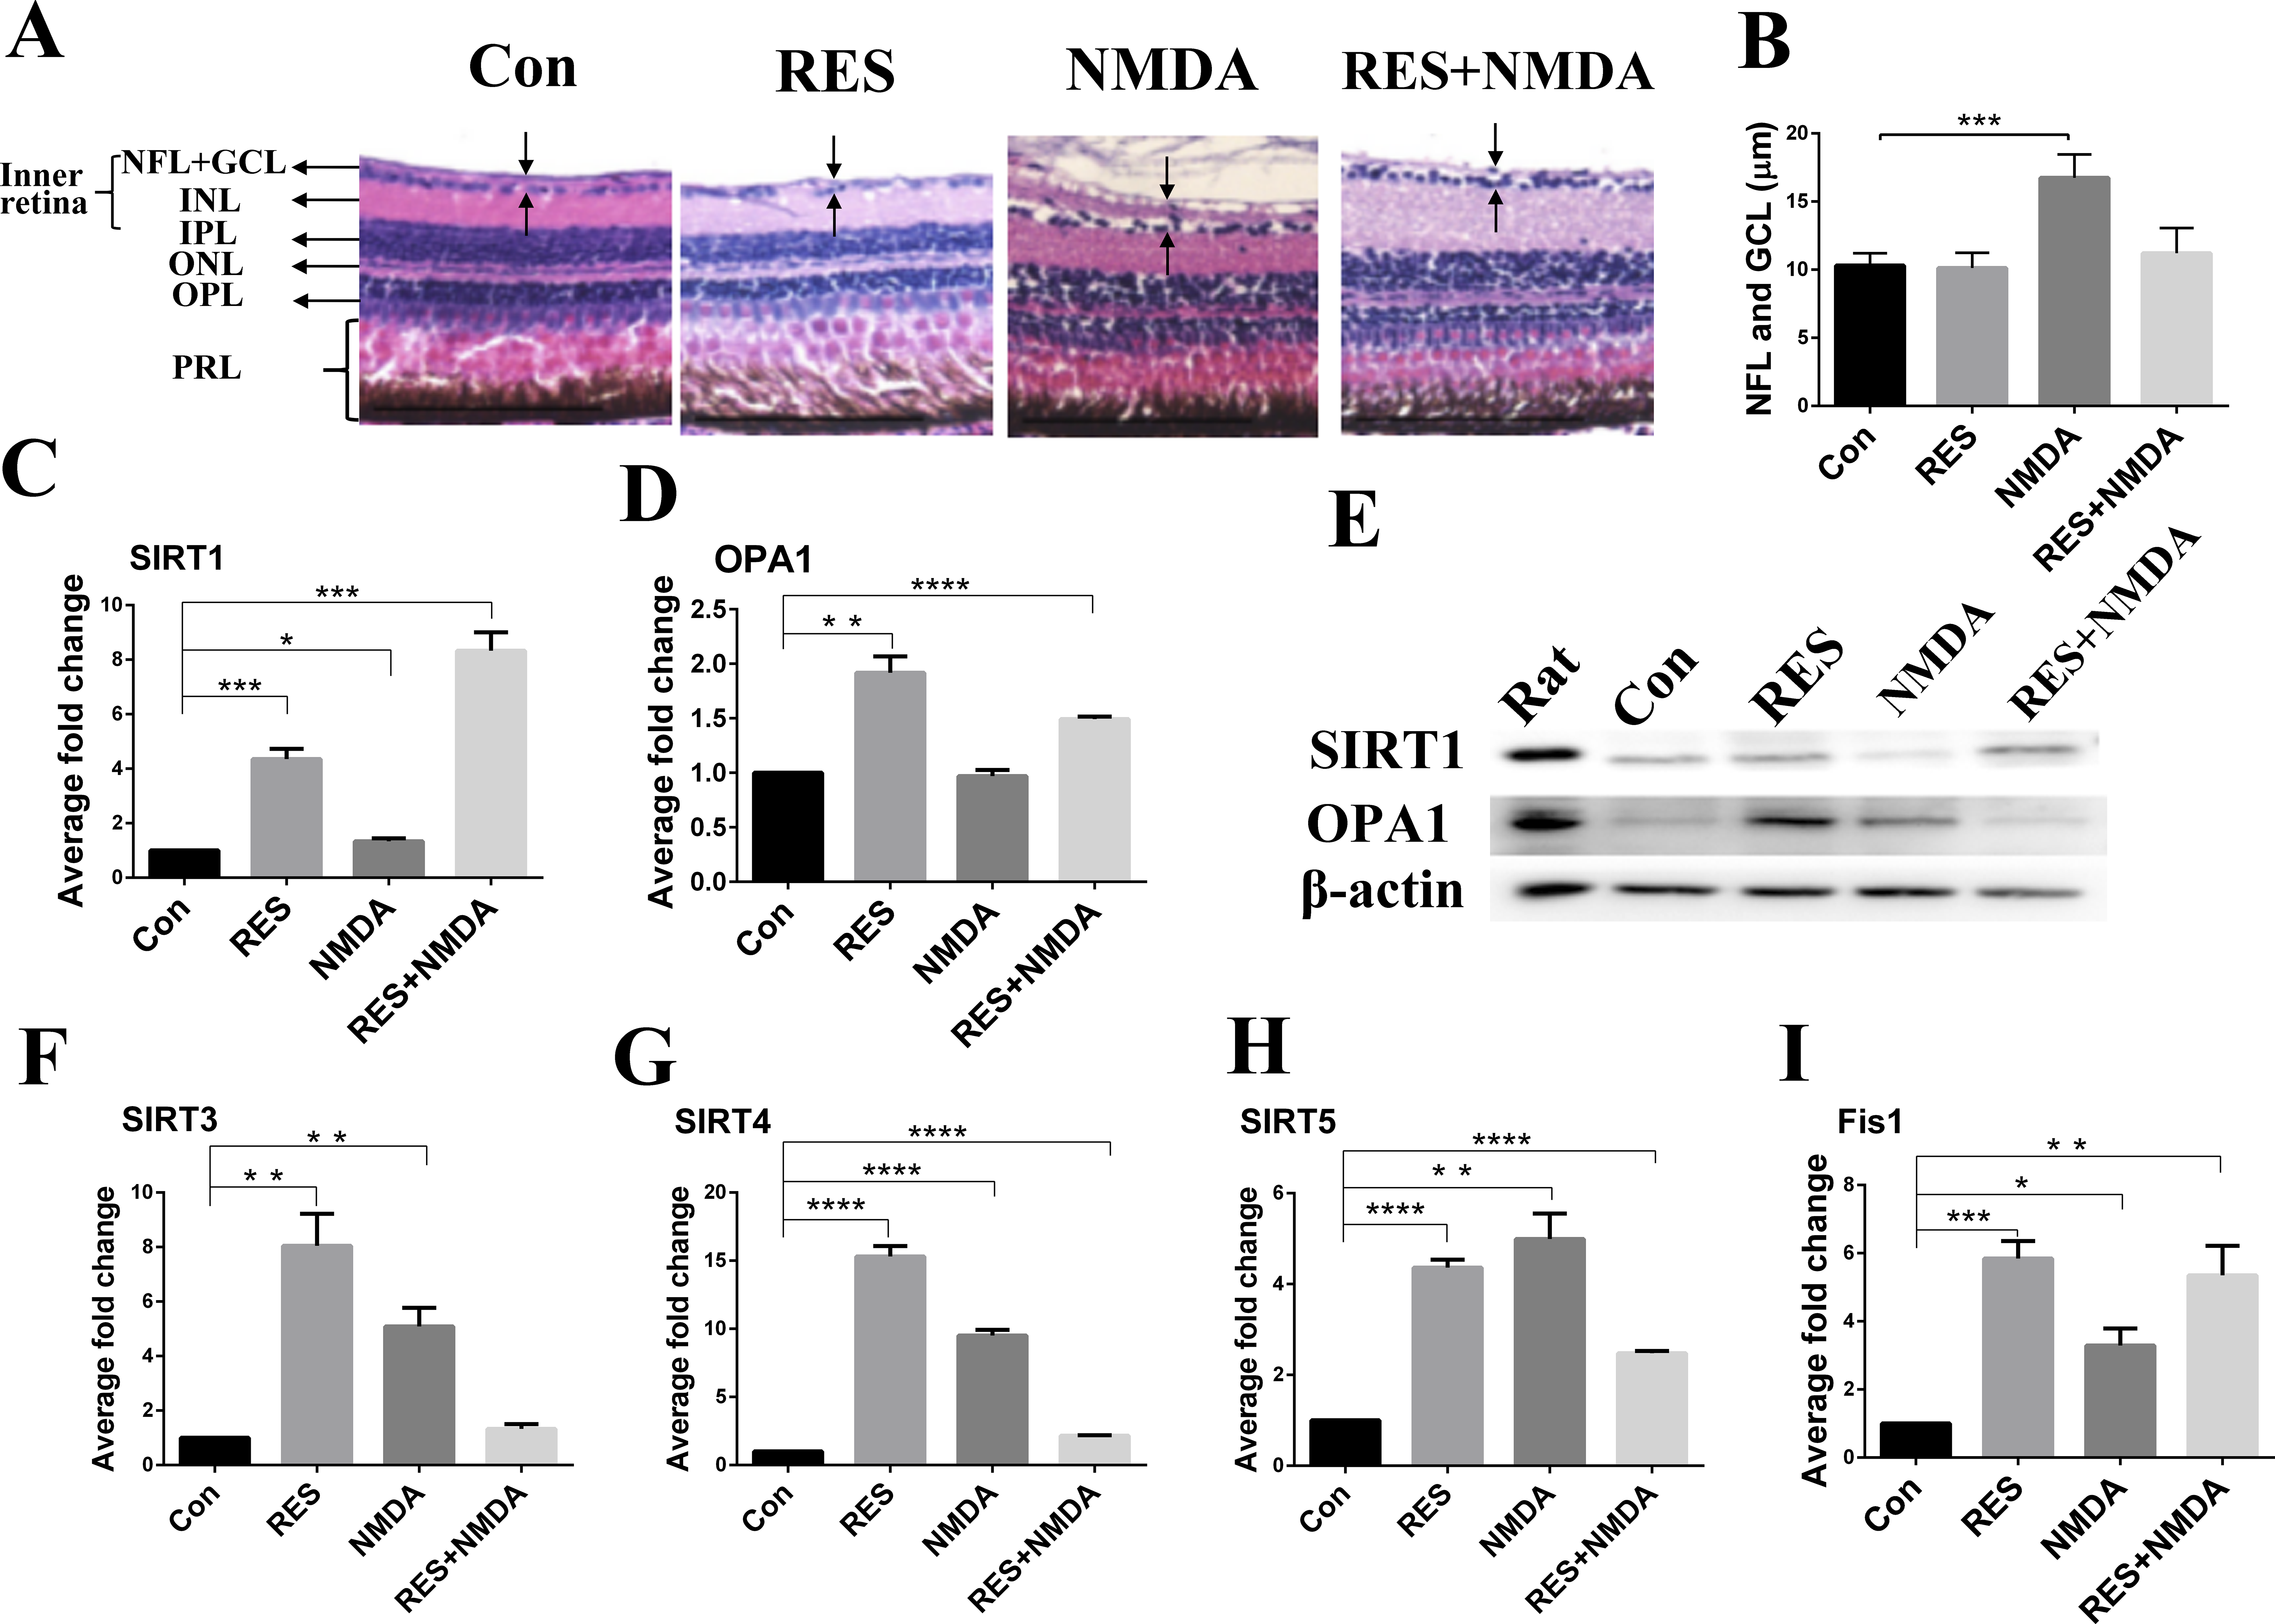
Figure Caption
Fig. 5
Effect of resveratrol on retinal SIRTs and mitochondrial gene expression after NMDA-induced retinal degeneration. (A) Comparison of retinal morphology of control and treatment groups in the peripheral retina. HE staining of retinal sections are shown. Scale bar: 100 μm. NFL, nerve fiber layer; GCL, ganglion cell layer; IPL, inner plexiform layer; INL, inner nuclear layer; OPL, outer plexiform layer; ONL, outer nuclear layer; PRL, photoreceptor layer. (B) Quantification of the nerve fiber and GCLs of adult zebrafish retina. Error bars: SEM; n = 5 for HE stained. (unpaired t-test, ***P < 0.001 compared to control) (C, D, F–I) SIRTs, OPA1, and Fis1 genes expression in zebrafish retina after exposure to 50 mg/L resveratrol,100 μM NMDA and 100 μM NMDA with 50 mg/L resveratrol for 24 hours. Graphic representation of average fold changes in (C) SIRT1, (D) OPA1, (F) SIRT3, (G) SIRT4, (H) SIRT5, and (I) Fis1 gene expression by qPCR. Error bars: SEM; n = 4 for qPCR. (unpaired t-test, *P < 0.05, **P < 0.01, ***P < 0.001, and ****P < 0.0001 compared to control) (E) Representative Western blot showing the level of SIRT1 and OPA1 protein expression of control and treatment groups for the 24 -hour time point in the retina. Rat served as a positive control; Con, control; RES, 50 mg/L resveratrol; NMDA, 100 μM NMDA; NMDA+ RES, 100 μM NMDA with 50 mg/L resveratrol.
Figure Data
Acknowledgments
This image is the copyrighted work of the attributed author or publisher, and
ZFIN has permission only to display this image to its users.
Additional permissions should be obtained from the applicable author or publisher of the image.
Full text @ Invest. Ophthalmol. Vis. Sci.