
|
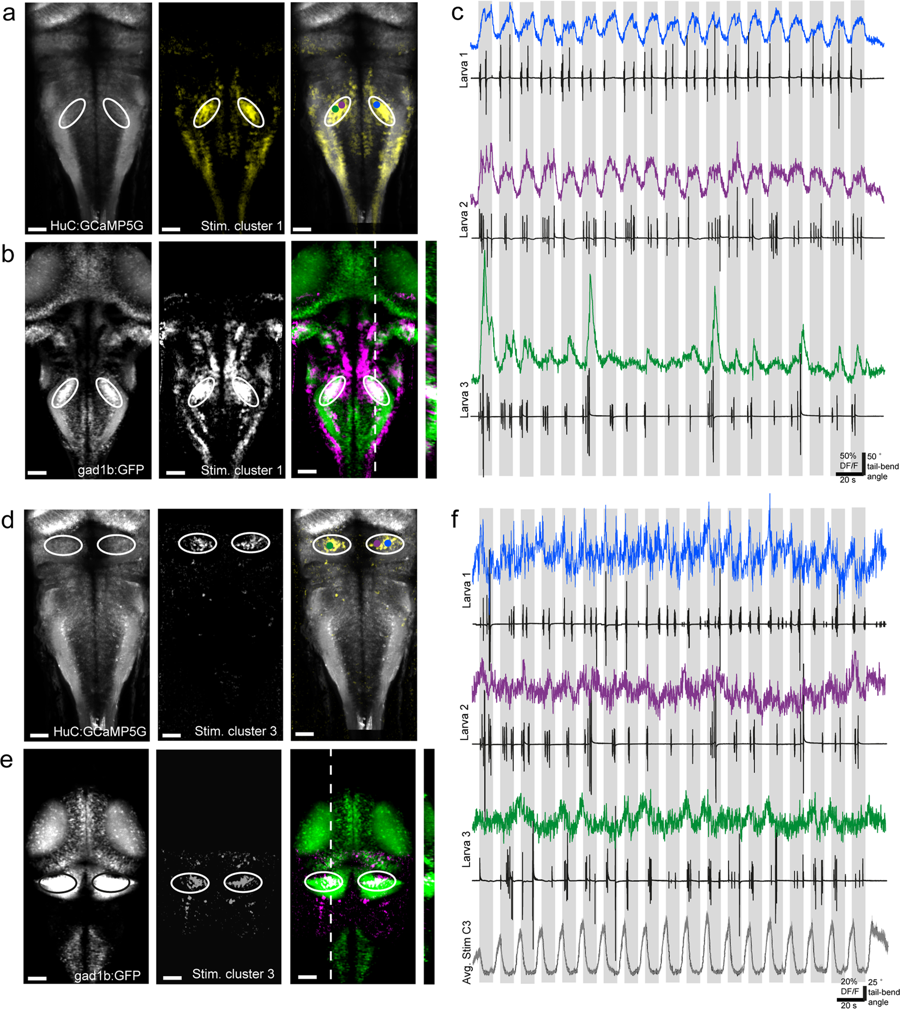
Fig. 4
Different GABAergic clusters in hindbrain and cerebellum show activity either positively or negatively correlated with the visual stimulus. (a) Z-projection stack of 20 optical sections imaged from the dorsal aspect of Tg(HuC:GCaMP5G) larvae compared with stimulus cluster 3. Panels left to right: Tg(HuC:GCaMP5G) larvae showing pan-neuronal localization of GCaMP5G; pixels correlated with stimulus cluster 3 averaged across all larvae; merge with HuC:GCaMP5G in grey and stimulus cluster 3 pixels in yellow. Area of interest is bounded by white circles. Colored dots represent ROIs plotted in (c). (b) Z-projection stack of 26 frames from stimulus cluster 3 correlated pixels registered with the ZBB atlas for the same area of interest as (a). Panels left to right: ZBB atlas stack of Tg (gad1b:GFP) expression; pixels correlated with stimulus cluster 3 averaged across all larvae; overlap of the two images with Tg(gad1b:GFP) shown in green and stimulus cluster 3 shown in magenta. Area of interest is bounded by white circles. Resliced image at right from position of white dotted line. (c) Example traces from three different larvae showing calcium activity from an ROI located within the area of interest outlined in white in panels (a,b). ΔF/F traces are shown in color matching the ROI centroid’s approximate location on panel (a, right). The accompanying tail traces for that individual trial are shown in black. Grey-shaded area indicates when stimulus is moving. (d) Z-projection stack of 25 optical sections imaged from the dorsal view in Tg(HuC:GCaMP5G) larvae compared with stimulus cluster 1. Panels left to right: Tg(HuC:GCaMP5G) larvae showing pan-neuronal localization of GCaMP5G; pixels correlated with stimulus cluster 3 averaged across all larvae; merge with HuC:GCaMP5G in grey and stimulus cluster 3 pixels in yellow. Area of interest is bounded by white circles. Colored dots represent ROIs plotted in (f). (e) Z-projection stack of 28 frames from stimulus cluster 3 correlated pixels registered with the ZBB atlas for the same area of interest as (d). Panels left to right: ZBB atlas stack of Tg (gad1b:GFP) expression; pixels correlated with stimulus cluster 3 averaged across all larvae; overlap of the two images Tg(gad1b:GFP) shown in green and stimulus cluster 3 shown in magenta. Area of interest is bounded by black or white circles. Resliced image at right from position of white dotted line. (f) Example traces from three different larvae showing calcium activity from an ROI located within the area of interest outlined in panels (d,e). ΔF/F traces are shown in color matching the ROI centroid’s approximate location on panel (d, right). The accompanying tail traces for that individual trial are shown in black. Below the average ΔF/F trace for pixels associate with stimulus cluster 3 with shading indicating +/− S.E.M (n = 76 ROIs from 8 larvae). Grey-shaded vertical bars indicate when visual stimulus is moving. Scale bars are 40 µm for (a,b) and (d,e).