
|
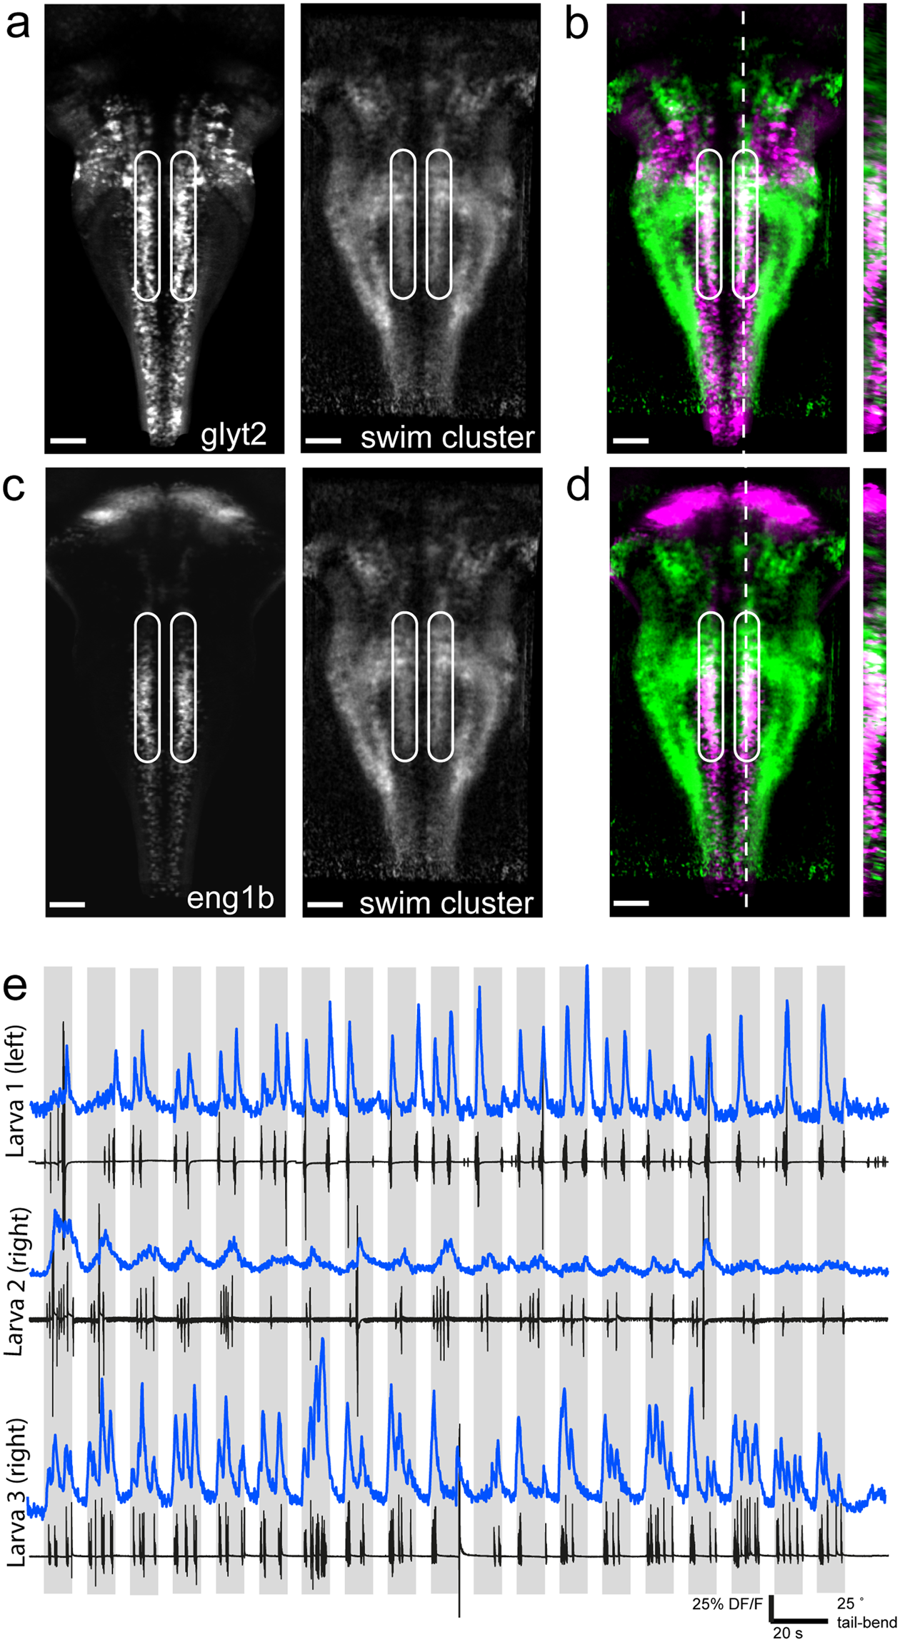
Fig. 3
Recruitment of a glycinergic and engrailed1b-positive stripe during locomotion. (a) Z-projection stack of 30 frames from our processed dataset registered with the ZBB atlas. Left: ZBB atlas stack of Tg(glyt2:GFP) expression; right: pixels correlated with swim cluster 1 (weighted average across larvae). Area of interest bounded by white circles. (b) Overlap of the two images in (a) with Tg(glyt2:GFP) shown in magenta and swim cluster 1 shown in green. Area of interest bounded by white circles. Resliced image at right from position of white dotted line. (c) Z-projection stack of 30 frames from our processed dataset registered with the ZBB atlas. Left: ZBB atlas stack of Tg(engrailed1b:Gal4;UAS:Kaede) expression; right: pixels correlated with swim cluster 1 averaged across all larvae. Area of interest bounded by white circles. (d) Overlap of the two images in (c) with Tg(engrailed1b:Gal4;UAS:Kaede) shown in magenta and swim cluster 1 shown in green. Area of interest bounded by white circles. Resliced image at right from position of white dotted line. (e) Example traces from three different larvae showing calcium activity from a single, manually draw ROI located within the area of interest above on one side of the midline (left or right, indicated). ΔF/F trace shown above in blue and the accompanying tail trace in black for the example trial. Grey-shaded area indicates when stimulus is moving. Scale bars are 40 µm for (a–d).