
|
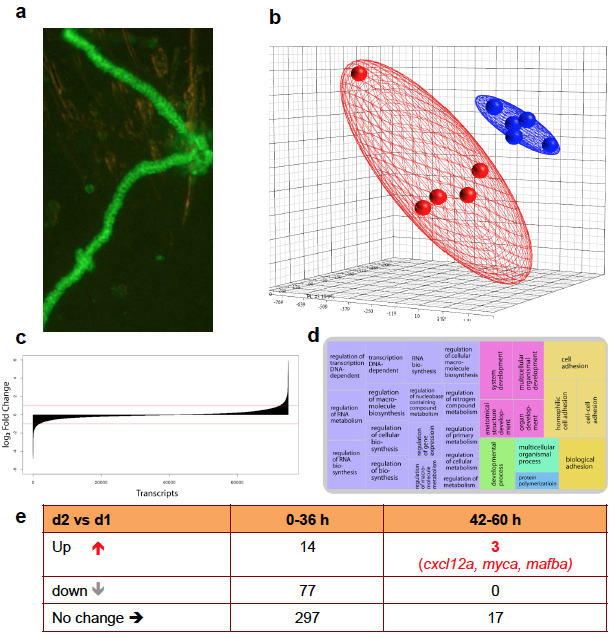
Fig. S5
Transcriptional profiles of one- and two-day-old zebrafish pronephric tubules.
(a) Fluorescently labeled pronephric tubules, isolated from cadh17:gfp transgenic zebrafish embryos. (b) 3D representation of the changes in the total transcript levels between samples from one- (red) and two-day-old zebrafish embryos (blue). Due to technical problems, one of the samples from the first group failed to cluster with the others probes, and was excluded from further analysis. (c) Density histogram representing the distribution of the log2-fold change of all transcripts. The horizontal red lines mark the two-fold change limit. (d) Biological process Gene Ontology (GO) terms enrichment analysis of the transcripts that were up-regulated more than two-fold in the pronephros on the second day of development. Semantically similar categories are represented with similar colors. The size of each box reflects the significance of enrichment (-log10 p-value). The GO analysis was performed with AmiGO and the GO enrichment was graphically represented with REViGO. (e) Comparison with the ZFIN Database and expression profiles, focusing on genes that are specifically expressed in the zebrafish pronephros at 42-60 hours post fertilization, revealed cxcl12a, myca and mafba as potential candidates involved in pronephros repair.