
|
Fig. 6
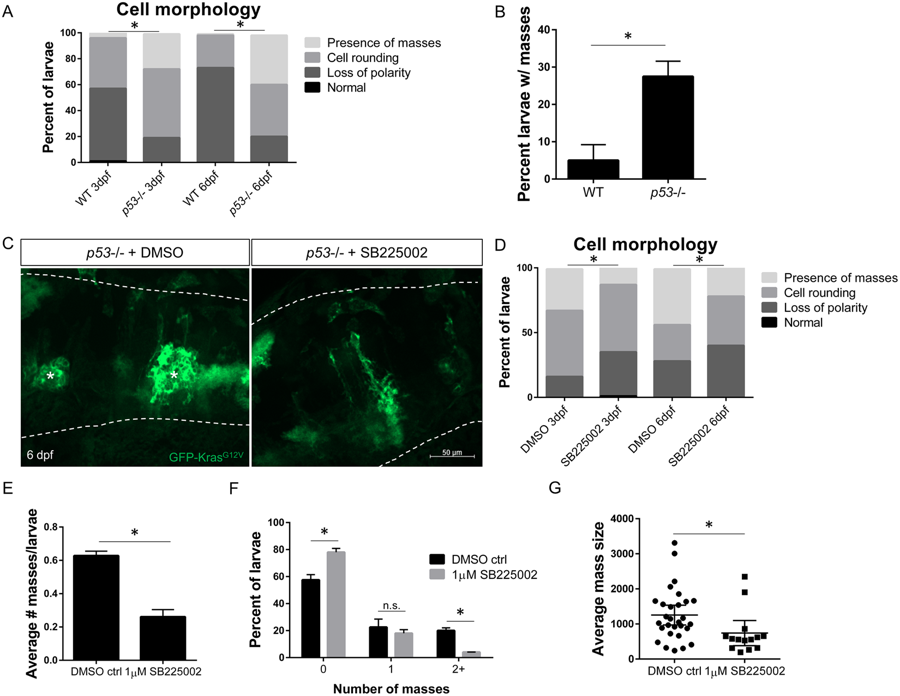
Inhibition of neutrophil chemotaxis reduces early mass formation in p53 mutant larvae. Morphology of gfap:GFP-krasG12V expressing astrocytes in WT or p53 mutant background at 3 and 6 dpf (A, n = 87 WT 3dpf, 113 p53−/− 3dpf, 75 WT 6 dpf, and 99 p53−/− 6dpf larvae; Chi-squared analysis performed). The percentage of larvae developing masses at 6 dpf is shown in (B). p53 mutant embryos were injected with gfap:GFP-krasG12V plasmid and treated with DMSO control or 1uM SB225002 beginning at 2.5 dpf with drug refreshed every 24 hrs. Larval hindbrain was live-imaged at 3 dpf and 6 dpf (6 dpf shown in (C), asterisks denote masses). Morphology of GFP-expressing cells was categorized as described in Fig. 1B (D, n = 84 DMSO 3 dpf, 88 SB225002 3 dpf, 39 DMSO 6 dpf, and 50 SB225002 6 dpf larvae; Chi-squared analysis performed). Average number of masses was quantified in all larvae at 6 dpf (E, n = 40 DMSO and 50 SB225005 larvae). Larvae were also categorized by number of masses formed (0,1, or ≥ 2) by 6 dpf (F) and in larvae with masses present, average mass size (μm2) was measured (G, n = 29 DMSO and 15 SB225002 larvae). *p < 0.05 For Supplementary Figure Legends, please see Supplementary Information file.