
|
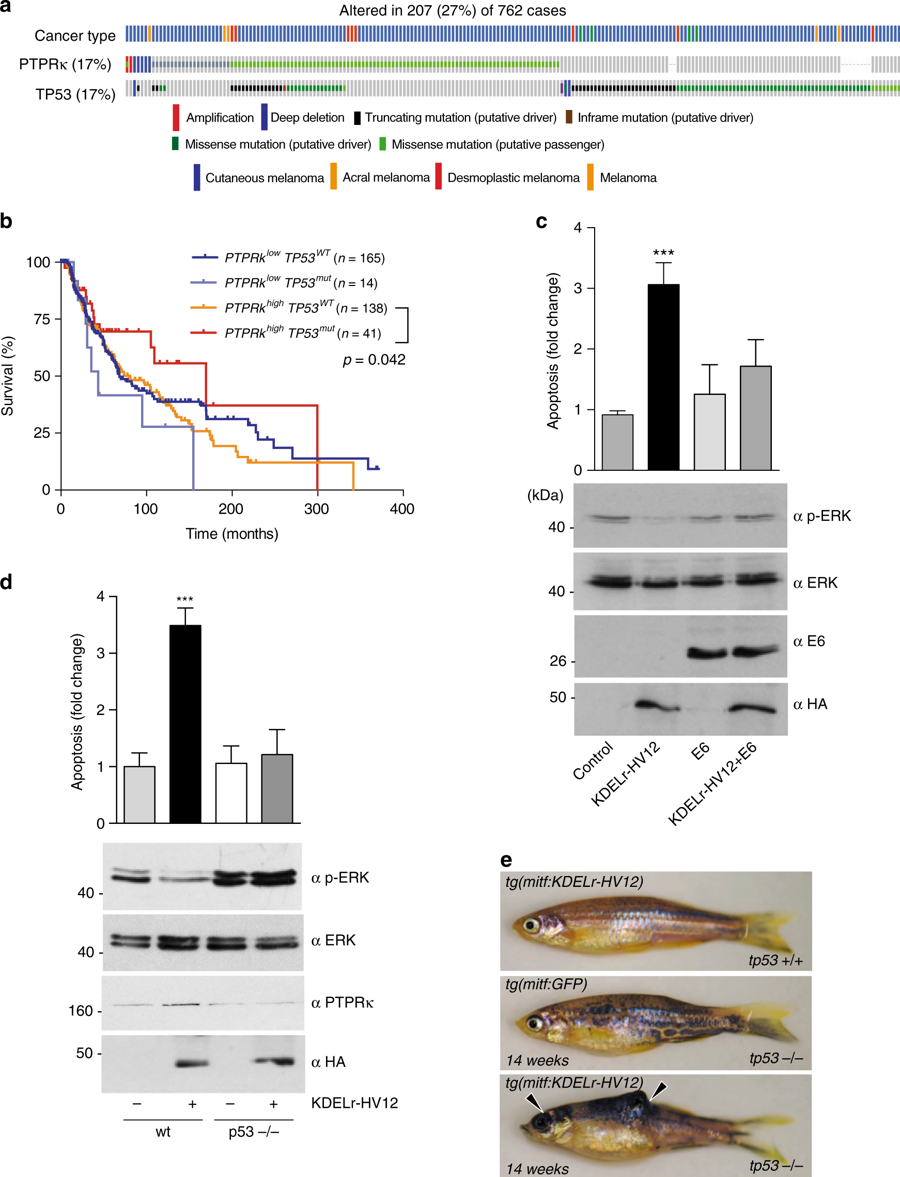
Fig. 10
TP53 status determines GC RAS-induced melanomagenesis. a Analysis of PTPRκ and TP53 mutational status generated using the TCGA dataset accessed through the cBioPortal for Cancer Genomics platform. b Survival curves for melanoma patients depending on PTPRκ expression levels and tp53 mutational status (obtained from TCGA melanoma dataset). c Effects of TP53 inactivation on ERK phosphorylation and apoptosis induced by GC RAS signals, as revealed in MCF-7 cells transfected with the indicated constructs. Data show average ± SEM from three independent experiments. ***p < 0.005 by Student's t-test. d Effects of TP53 status on ERK phosphorylation and apoptosis induced by GC RAS signals, as revealed in MEFs, wild-type (wt) and tp53-null,transfected with KDELr-HV12 (1 μg) where shown (+). Data show average ± SEM from three independent experiments. ***p < 0.005 by Student's t-test. e tp53 inactivation is sufficient to promote melanomagenesis by GC RAS signals. Arrowheads show melanoma lesions in tp53−/− zebrafish expressing the KDEL-HV12 transgene after 14 weeks. See also Supplementary Fig. 9