
|
Fig. 9
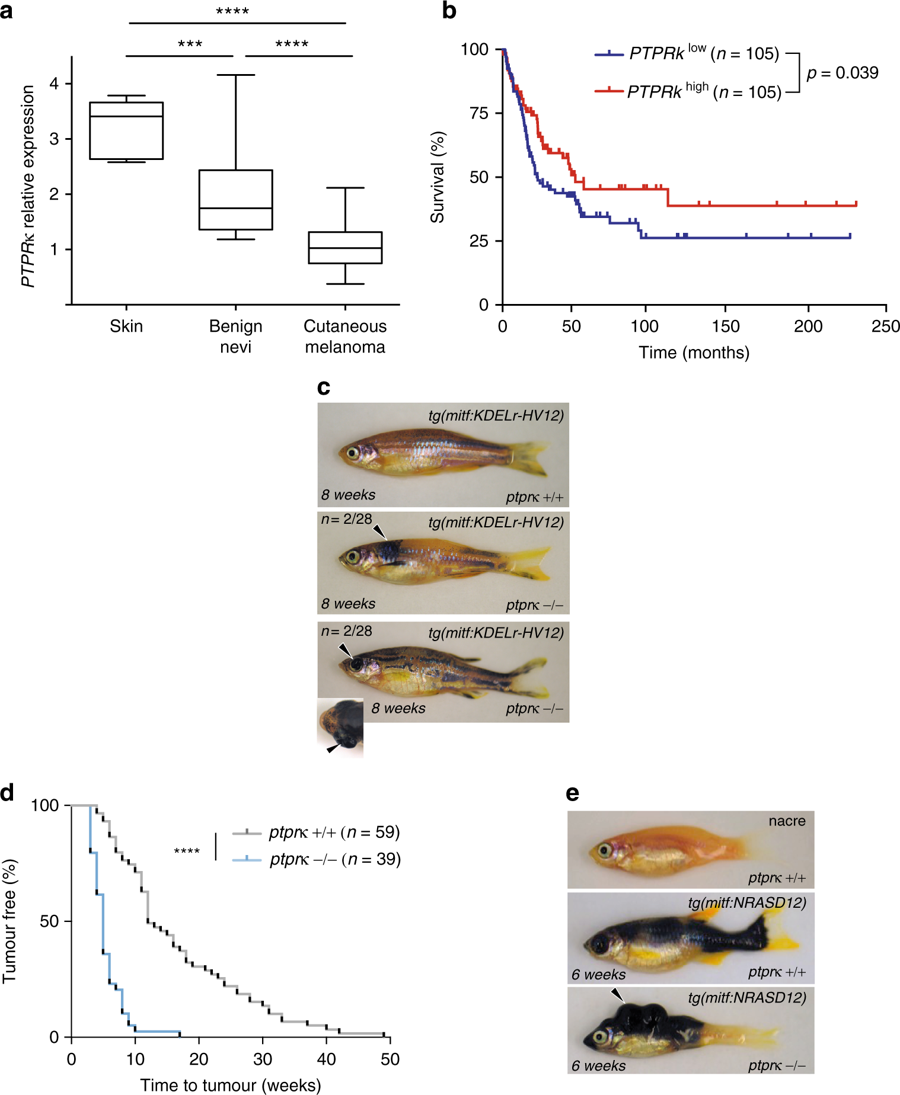
PTPRκ is a tumor suppressor in melanoma. a Analysis of PTPRκ expression in normal skin (n = 7), benign nevi (n = 18) and cutaneous melanoma samples (n = 45) generated using an available gene dataset, accessed through the Oncomine® platform. ***p < 0.001 ****p < 0.0001 by Student's t-test. b Survival curves for melanoma patients depending on PTPRκ expression levels (obtained from GEO GSE65904). c View of naevi (2/28; arrowhead, middle panel) and melanoma (2/28; arrowhead bottom panel, points to a protruding eye with a retroorbital tumor.) by 52 weeks post fertilization in ptprκ nullizygous zebrafish expressing KDELr-HV12 as a transgene. Representative pictures were taken at 8 weeks post fertilization. d Kaplan–Meier plot of tumor development in ptprκ wild-type nacre animals compared to ptprk−/− nacre animals, injected with NRAS-G12D. ****p < 0.0001 by Mantel-Cox test. e Representative melanoma lesions (see arrowheads) in zebrafish with the indicated ptprκ genotype expressing NRAS-G12D as a transgene. See also Supplementary Fig. 8