
|
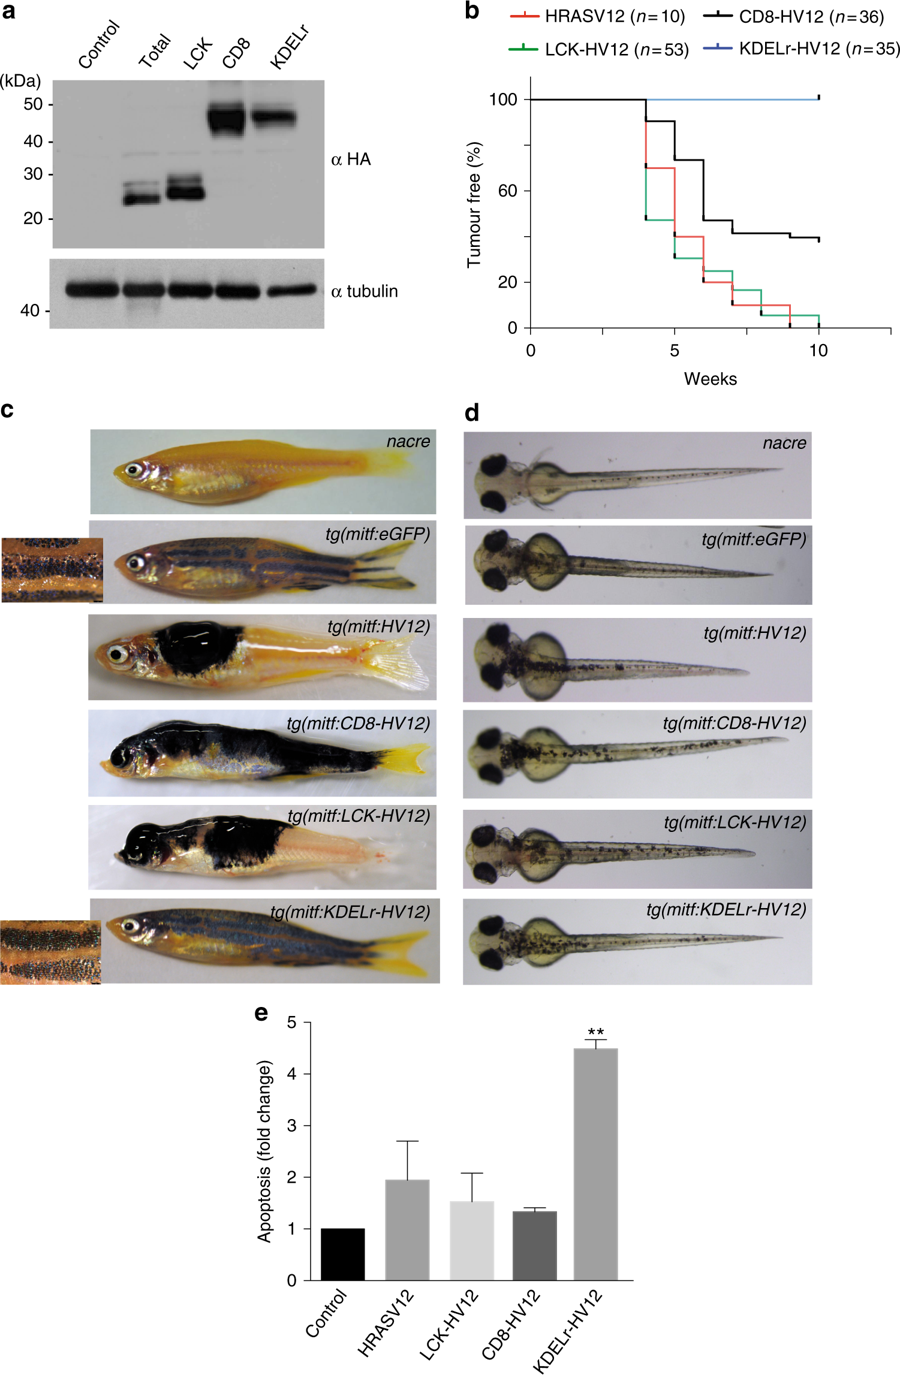
Fig. 8
Oncogenic effects of activated RAS at the GC. a Expression of the indicated constructs transfected (1 μg) in CHL melanocytes. b Kaplan–Meier plot of the Incidence of melanoma by 10 weeks post fertilization in nacre zebrafish expressing the indicated HRASV12 site-specific transgenes using the miniCoopR system. c Representative images of adult zebrafish expressing the indicated HRASV12 site-specific transgenes at 8 weeks post fertilization compared to nacre. Insets are magnification of stripes. d Representative images of zebrafish embryos expressing the indicated HRASV12 site-specific transgenes at 3 days post fertilization compared to uninjected nacre. e Apoptosis induction by the indicated HRASV12 site-specific constructs in CHL melanoma cells. Results, relative to the values found in vector-transfected cells, show average ± SEM from three independent experiments **p < 0.01 by Student's t-test. See also Supplementary Fig. 7