
Image
|
Figure Caption
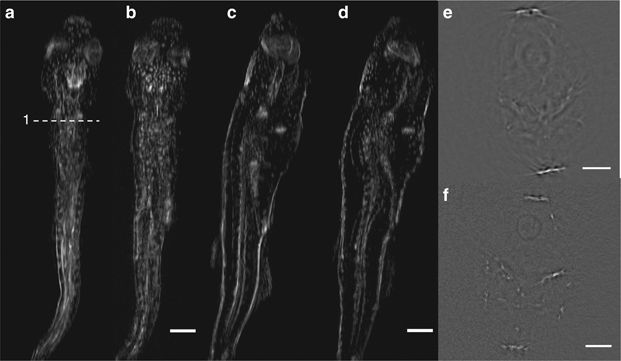
Fig. 4
Comparison of MORSOM at 50 MHz and at 100 MHz. (a) Side view MIP from MORSOM at 50 MHz. (b) Side view MIP from the 100 MHz data. (c) Top view MIP from the 50 MHz data. (d) Top view MIP from the 100 MHz data. (e) Cross section through the Zebrafish at 50 MHz compared with (f) 100 MHz. (Scale bars=a–d 500 μm; e,f 250 μm).
Acknowledgments
This image is the copyrighted work of the attributed author or publisher, and
ZFIN has permission only to display this image to its users.
Additional permissions should be obtained from the applicable author or publisher of the image.
Full text @ Light Sci Appl