
|
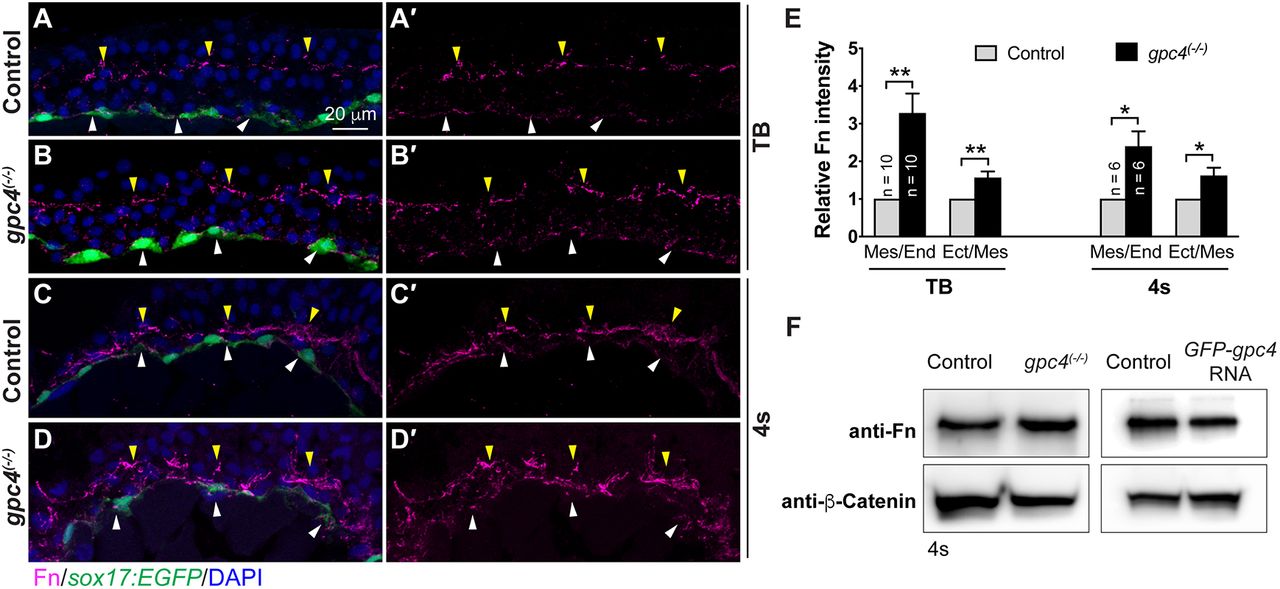
Fig. 5
Fibronectin (Fn) expression is increased in gpc4 mutant embryos and reduced in GFP-Gpc4 expressing embryos. (A-E) Immunostaining of transverse cryosections for Fn deposition. (A-D′) Representative confocal z-stack images showing Fn (magenta) and nuclei (DAPI, blue) in embryos indicated. Fn assembly at mes/end (white arrowheads) and ect/mes (yellow arrowheads) boundaries. (E) Relative Fn intensity at mes/end and ect/mes boundaries in control and gpc4 mutant embryos. The number of embryos analyzed is shown in the graph. (F) Western blot showing the expression of Fn and β-catenin (internal control) in embryos indicated. **P<0.01, *P<0.05; Student's t-test.