
|
Fig. 3
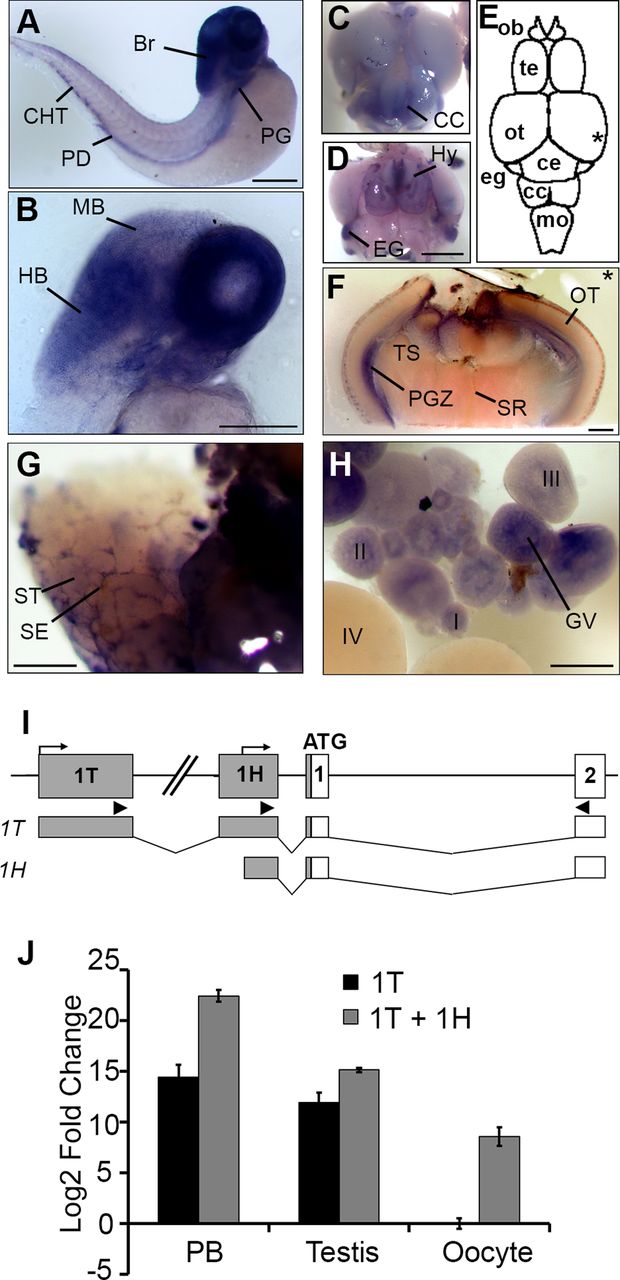
Alternative promoters drive Hemogen expression in hematopoietic and nonhematopoietic tissues in zebrafish. WISH of wild-type embryos (A-B) and adult tissues (C-H). (A) 48 hpf. Hemogen expression in the pronephric kidney glomeruli (PG), pronephric tubule duct (PD), caudal hematopoietic tissue (CHT) and brain (Br). (B) 48 hpf. Section showing strong Hemogen expression in the hindbrain (HB) but at low levels in the midbrain (MB). (C,D) Dorsal (C) and ventral (D) views of the adult zebrafish brain after staining for Hemogen transcripts. CC, crista cerebellaris; Hy, hypothalamus; EG, eminentia granularis. (E) Schematic drawing of the dorsal view. Hemogen was highly expressed at the midbrain-hindbrain boundary within the EG, in the CC and in the Hy. The asterisk indicates the plane of the cross-section in panel F. (F) Section of the hindbrain showing Hemogen expression in the periventricular gray zone (PGZ). (G) Hemogen was expressed by Sertoli cells (SE) between the seminiferous tubules (ST) of the testes. (H) Hemogen was expressed in early (I-III) but not late (IV) stage oocytes. Transcripts accumulated around the germinal vesicle (GV). (I) Schematic of the Hemogen noncoding exons 1T and 1H (gray) upstream of the first coding exon (white); bent arrows, transcription initiation sites. Arrowheads mark primer binding sites for qPCR amplification of transcripts initiated from exons 1T or 1H. (J) Expression of transcripts from alternative promoters determined by qRT-PCR using RNA from blood, testes and ovaries of adult TU zebrafish. Expression in three biological replicates were normalized to β-actin and calculated relative to ovaries. Error bars represent the standard deviation. Transcription initiated from 1H must be inferred by difference [1H – 1T] because the 1H primers also amplified 1T transcripts. Other abbreviations: Ce, corpus cerebelli; MO, medulla oblongata; OB, olfactory bulb; OT, optic tectum; SR, superior raphe; Te, telencephalon; TS, torus semicircularis. Scale bars: 250 µm (A,B,F-H); 1 mm (C,D).