
|
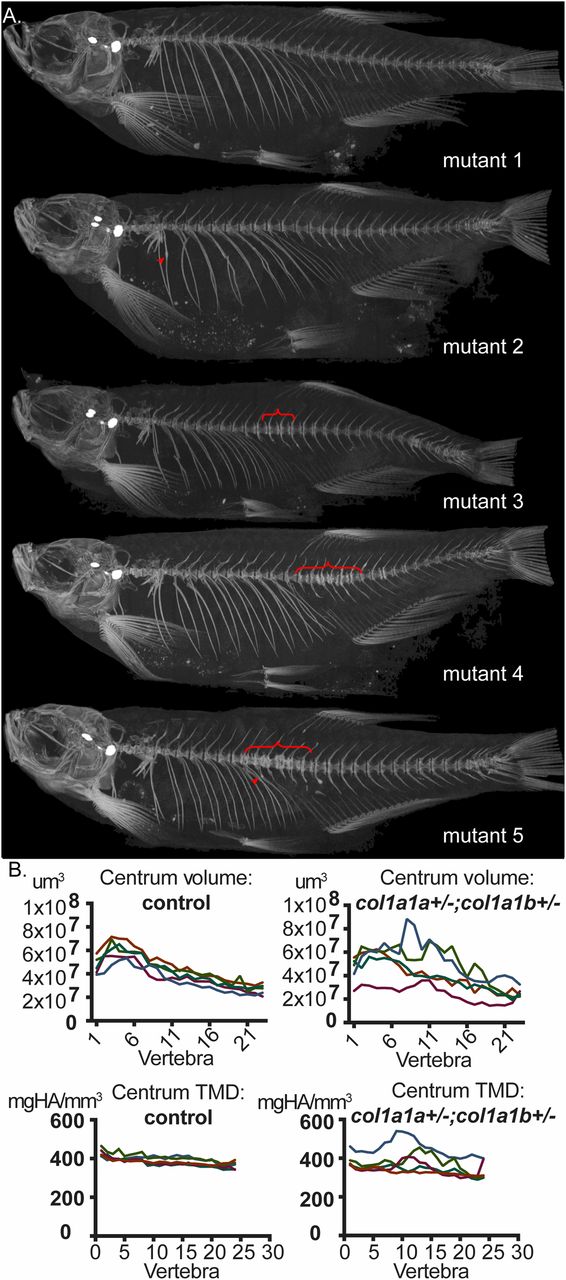
Fig. 4
col1a1a+/−;col1a1b+/− mutant fish exhibit intragroup variability in phenotypic expressivity. (A) Different col1a1a+/−;col1a1b+/− mutant siblings were analyzed using µCT scanning at 5 mo of age (mutant 1 to mutant 5). Upon comparison of the different mutant siblings, both incomplete penetrance and a variable expressivity of features indicative of compromised bone quality was observed, which include fractures (arrowheads) and local compressions in the vertebral column causing a distorted shape of the vertebral bodies (brackets). (B) Intragroup variability for col1a1a+/−;col1a1b+/− mutant fish is demonstrated for volume and TMD of the vertebral centra, with values in the mutant group showing a much larger spread than compared with the control group. The different colors in one graph represent different individual fish of the same group (mutant siblings or control siblings).