
Image
|
Figure Caption
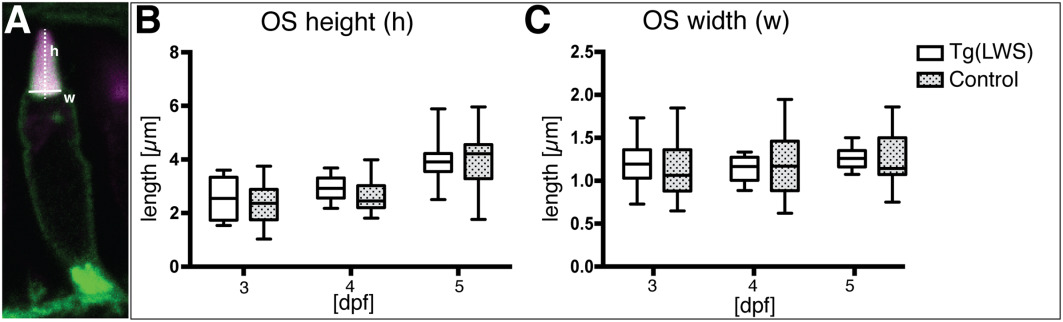
Fig. 3
No obvious changes were detected in outer segment size of Tg(LWS) PRCs. A: Photoreceptor cell of Tg(LWS)/Tg(Ola.Actb:Hsa.HRAS‐EGFP)vu119 at 3 dpf showing mKate2 in magenta and green fluorescent protein at the plasma membrane in green. Outer segment height (h, dotted line) was calculated by measuring the distance from the midpoint at the base of the outer segment to the tip. Outer segment width (w, full line) was calculated by measuring the length of the OS base. B,C: Outer segment height (B) and width (C) were measured in both Tg(LWS)/ Tg(Ola.Actb:Hsa.HRAS‐EGFP)vu119 (white box) and Tg(Ola.Actb:Hsa.HRAS‐EGFP)vu119 stained with red opsin antibody (gray box with dots) at 3 dpf, 4 dpf, and 5 dpf. Measurements are represented in box plots with calculated minimum, 25th percentile, mean, 75th percentile, and maximum. The x‐axis shows the age of the embryos in days postfertilization, and the y‐axis shows the length measured in μm. For all time points and different transgenic lines, at least three independent samples were used and 20 measurements were carried out. Statistical significance was calculated by a one‐way ANOVA followed by Tukey's multiple comparison test. No statistically significant differences were observed.
Acknowledgments
This image is the copyrighted work of the attributed author or publisher, and
ZFIN has permission only to display this image to its users.
Additional permissions should be obtained from the applicable author or publisher of the image.
Full text @ Dev. Dyn.