
Image
|
Figure Caption
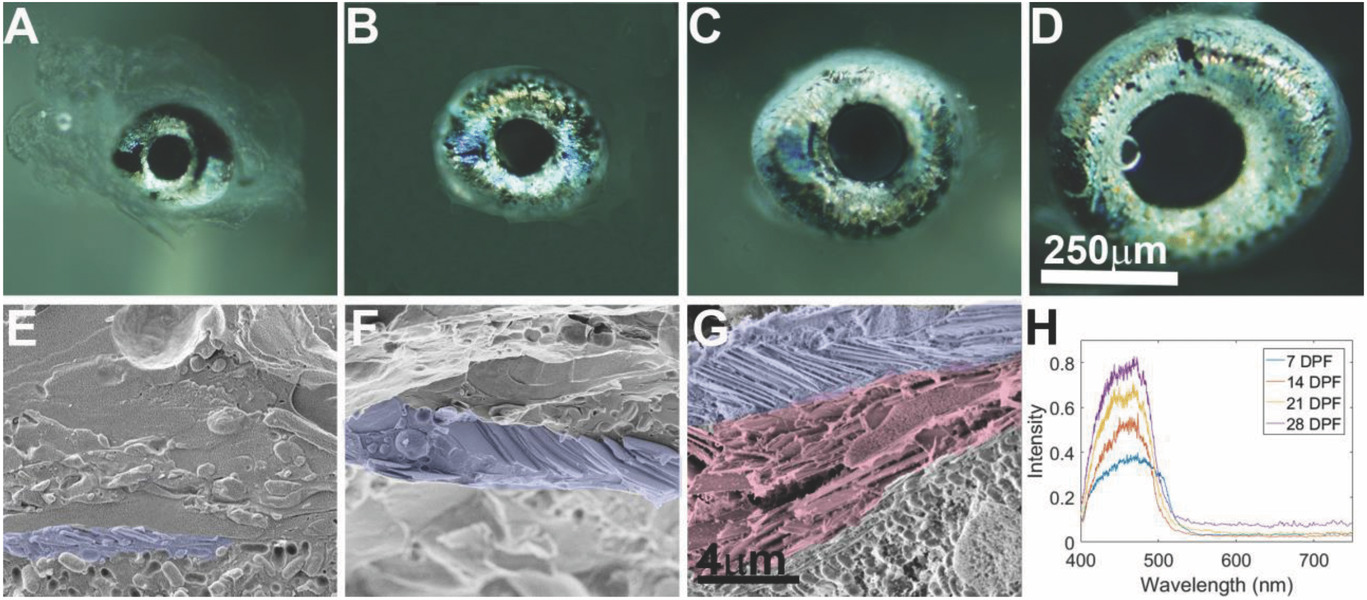
Fig. 3
Iris development. Iris morphology, ultrastructural and optical properties were examined during development at 7 (A,E), 14 (B,F), 21 (C,G), and 28 (D) dpf. A–D) Light microscope images of the larva iris at different stages. E–G) Cryo‐SEM images of high‐pressure frozen, freeze‐fractured larva iris show the ultrastructure of the developing iris. Whereas at 7 and 14 dpf only the ordered layer is seen, by 21 dpf a second, disordered layer starts to appear. Ordered iridophores (purple) and disordered iridophores (light red) are shown in pseudo‐colors. H) Graph showing measured reflectance of irises from 7, 14, 21, and 28 dpf larvae, revealing a peak reflectance centered around 450 nm. Scale bars: 250 µm (A–D), 4 µm (E–G).
Acknowledgments
This image is the copyrighted work of the attributed author or publisher, and
ZFIN has permission only to display this image to its users.
Additional permissions should be obtained from the applicable author or publisher of the image.
Full text @ Adv Sci (Weinh)