
|
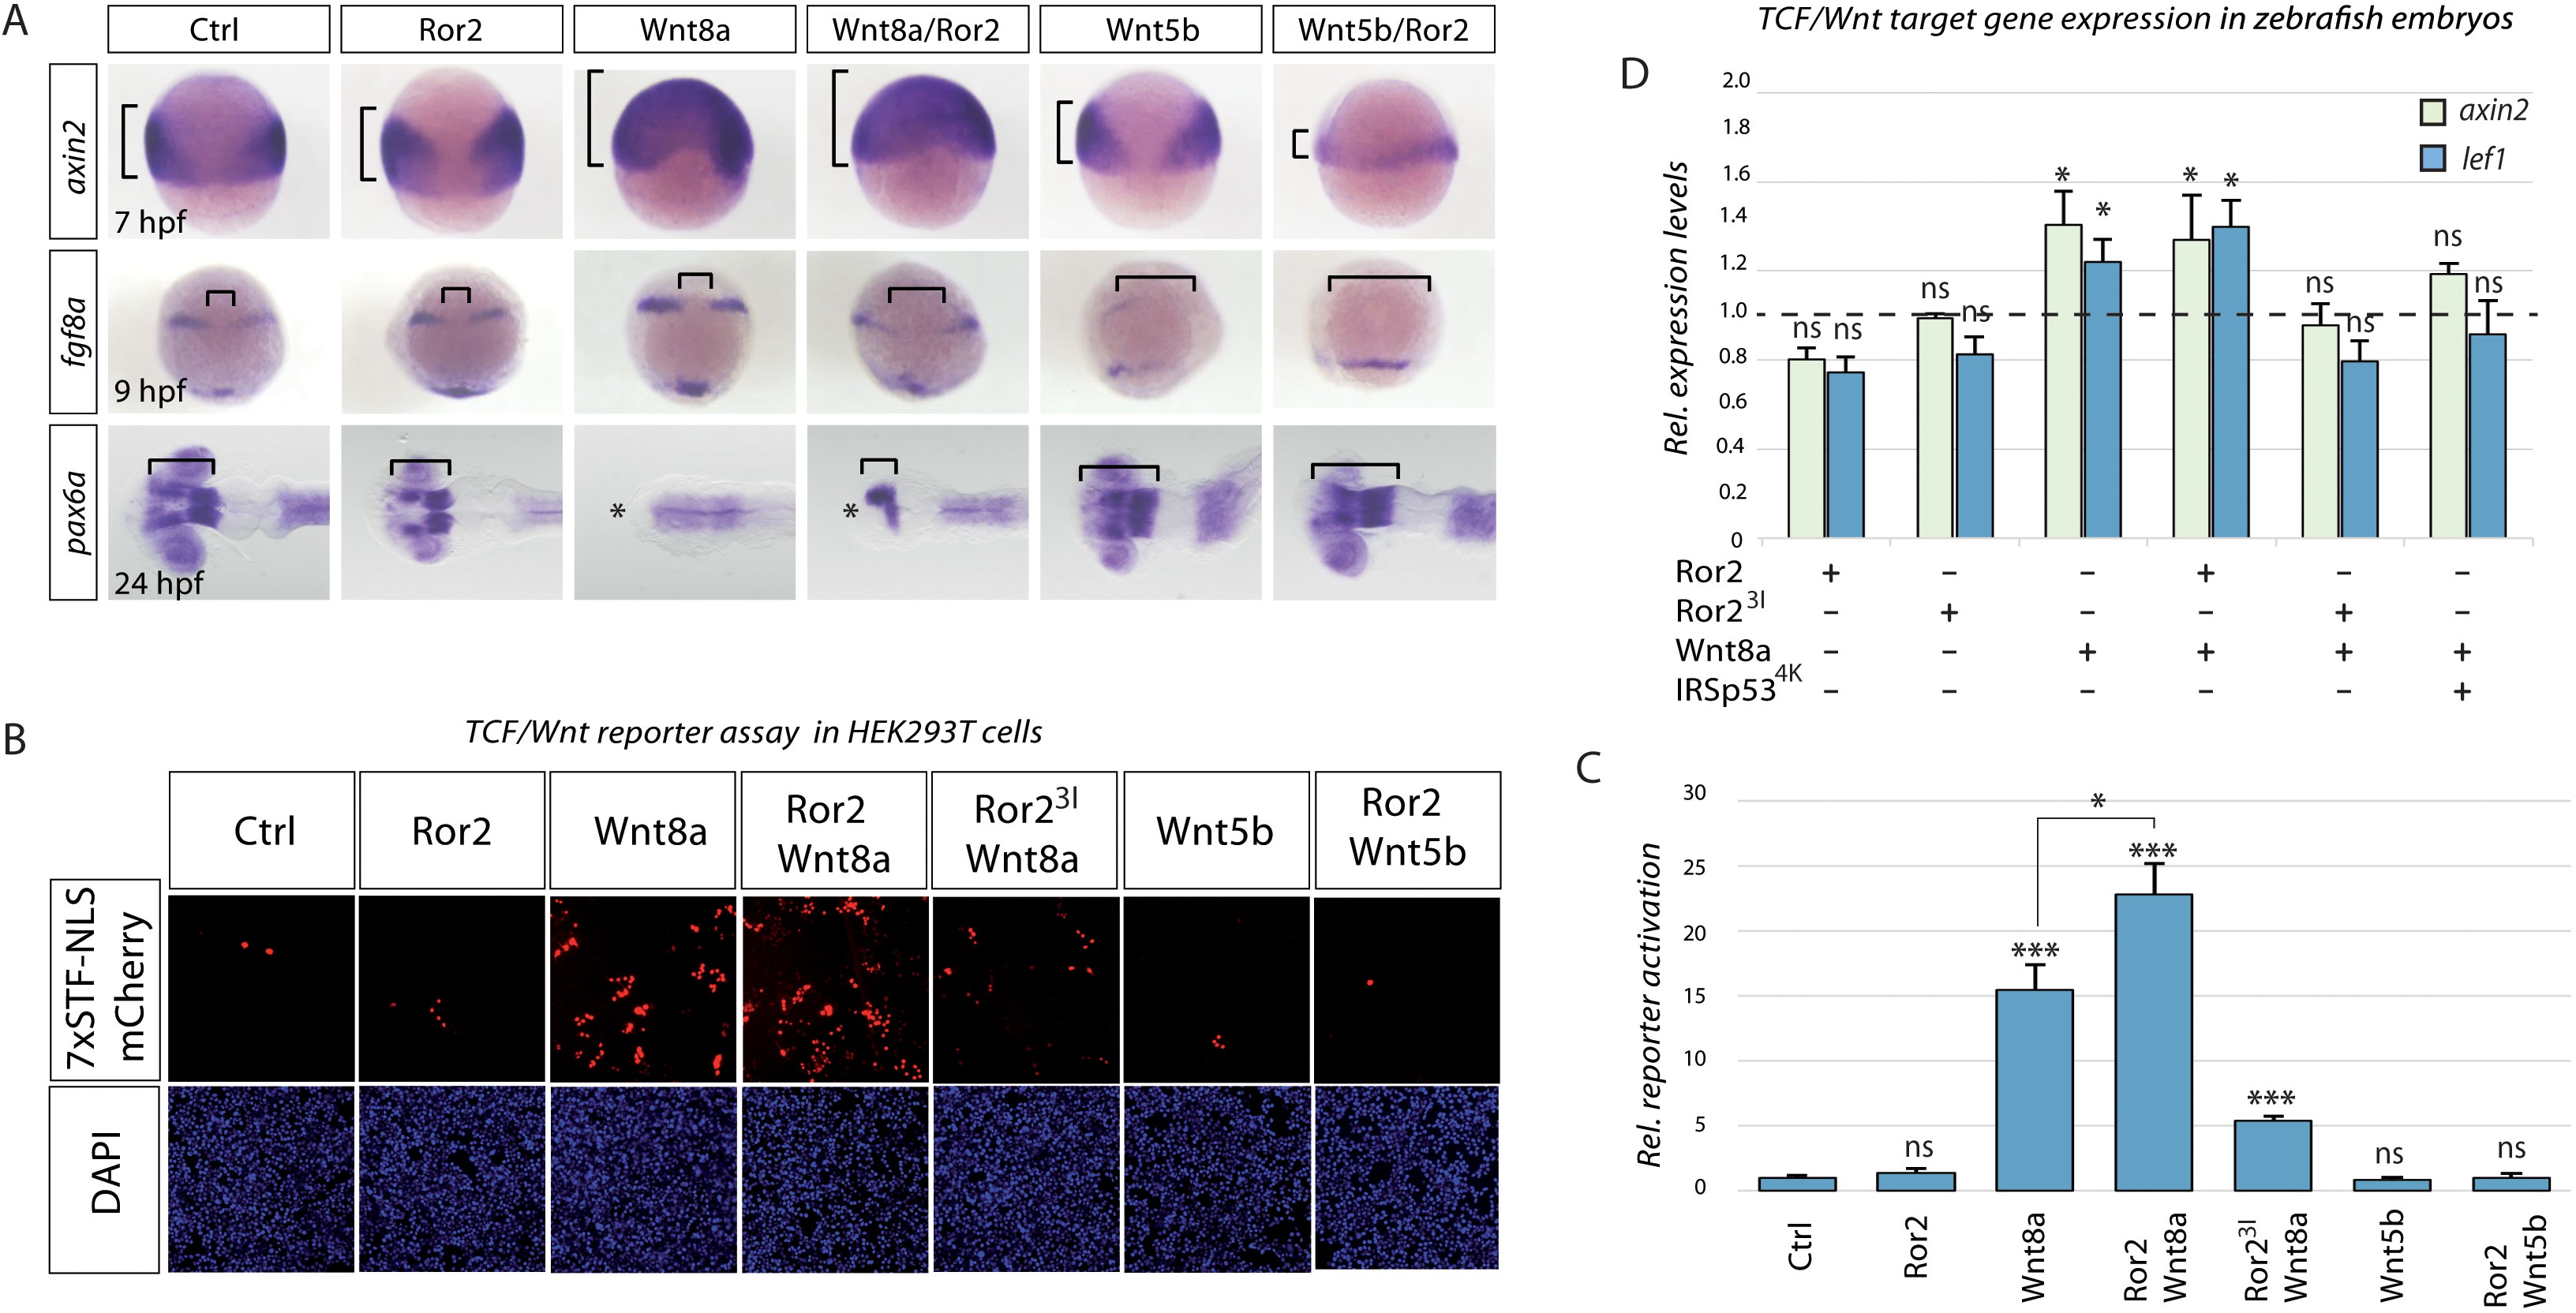
Fig. 6
Ror2 enhances paracrine Wnt/β-catenin signaling in zebrafish embryos and HEK293T co-culture.
(A) Microinjected embryos at the indicated stages were fixed and subjected to in situ hybridization against the Wnt target gene (axin2) or against markers for brain patterning (fgf8a, pax6a). Brackets indicate the expansion of Wnt target gene expression (axin2), distance of fgf8 expression domains or forebrain territory (pax6a), while asterisks indicates a lack of forebrain tissue. (B) Co-culture reporter gene assay in HEK293T cells. The TCF/Wnt reporter population was transfected with 7xTRE Super TOPFlash-NLS-mCherry and Lrp6 and co-cultured with a second population as indicated. The co-culture principle is illustrated in Figure 6—figure supplement 1. (C) Relative reporter activation by measuring the mCherry signal. The bar chart shows the mean value with SEM of three independent experiments. Scale bar represents 200 µm. (D) RT-qPCR-based expression assay in zebrafish embryos. Embryos were injected at the 16-cell stage to generate a distinct signaling center at 75% epiboly (see Figure 6—figure supplement 1 for details) and were subjected to RTqPCR. Relative ΔΔCt expression values of Wnt-β-catenin target genes axin2 and lef1 are acquired by normalization to actb1 and in comparison to a control-injected sample (relative ctrl expression level shown as a dotted line). Each condition represents the mean Rt-qPCR result of 4 × 50 embryos acquired from two independent experiments. *** P < 0.001, * P < 0.05. ANOVA confirmed the hypothesis that expression levels are different between treatments with a p=0.00025, confidence interval 95%, F value=33.9, df=11.