
|
Fig. 4
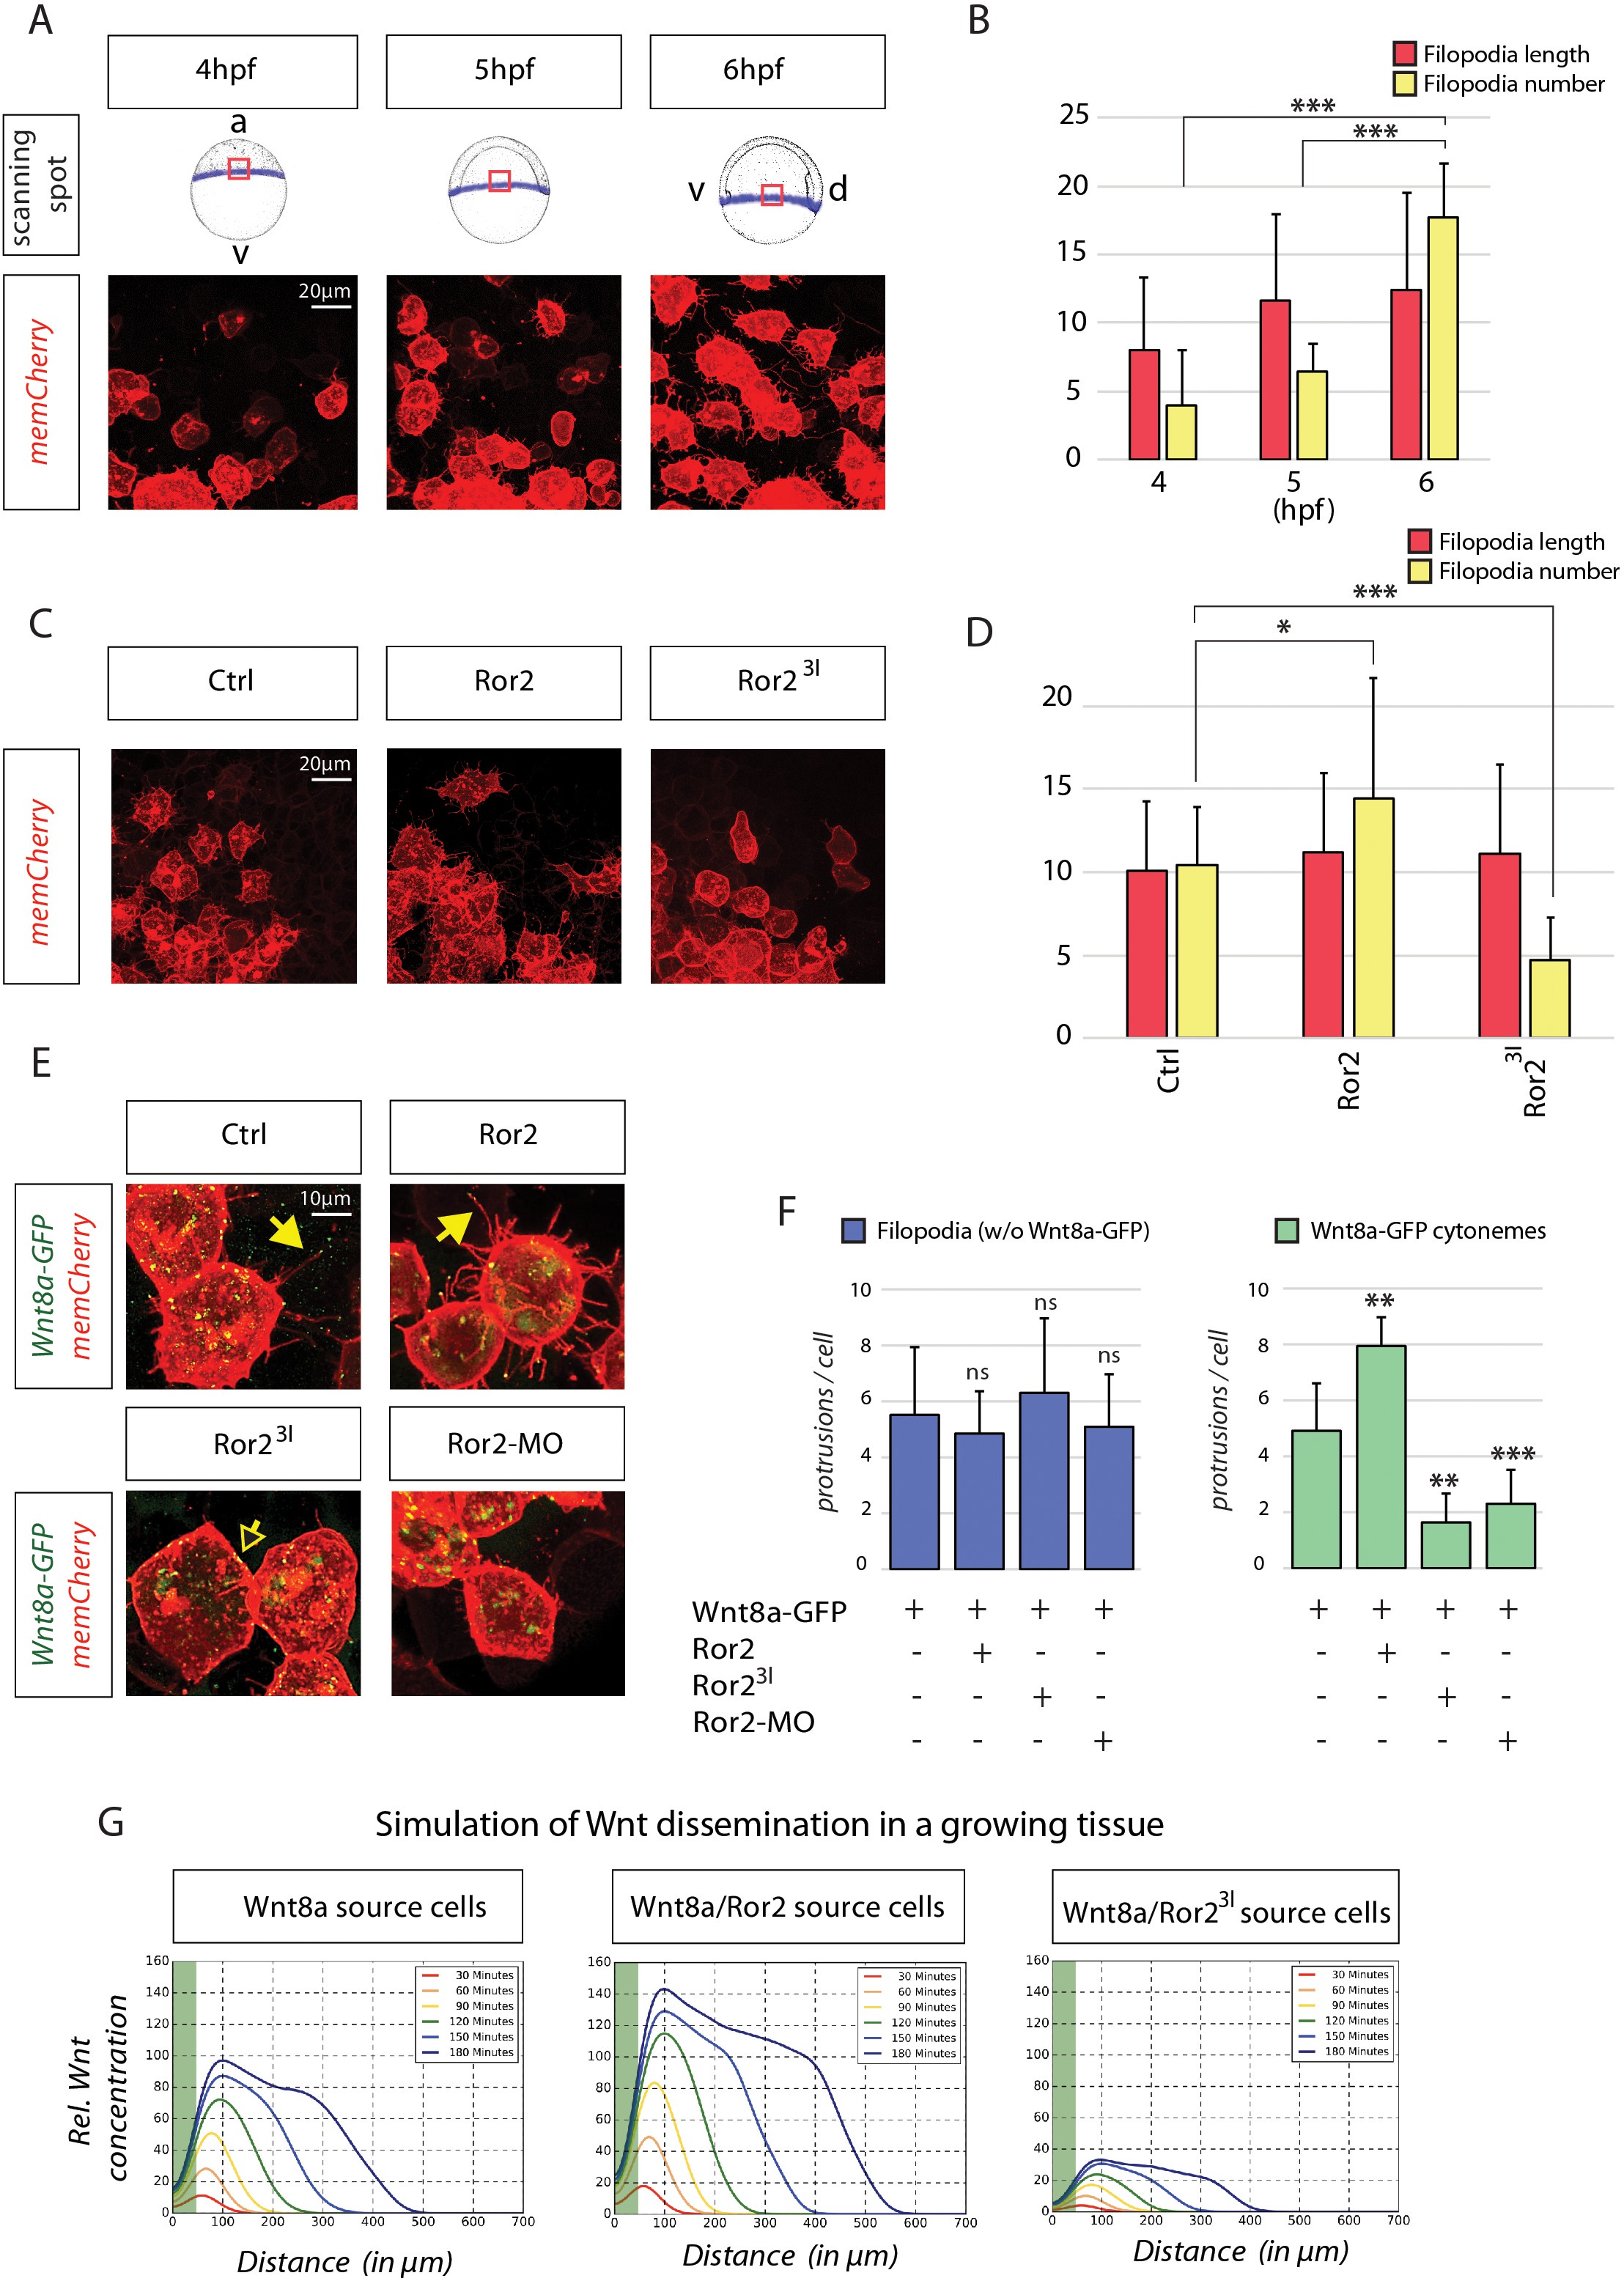
In-depth analysis and simulation of Wnt-positive cytonemes in zebrafish embryos in vivo.
(A) Live confocal microscopy analysis of filopodia dynamics over time. Mosaic expression of memCherry was utilized to quantify the protrusions of single cells at the indicated positions. The image shows the same cells at different times during zebrafish gastrulation. (B) Filopodia of cells in (A) were measured using semi-quantitative segmentation software (see Figure 4—figure supplement 1 for details). Quantification illustrates the mean filopodia length and the number of filopodia per cell with SEM at different time points. (C) Effect of Ror2 on filopodia length and number. Live confocal microscopy analysis of the filopodia of embryos injected with Ror2 or Ror23I mRNA at the one-cell stage. (D) Diagram of mean filopodia length and number per cell with SEM. (E) Analysis of Wnt cytonemes during live imaging. Embryos were microinjected at the 16-cell stage to generate a cell clone expressing Wnt8a-GFP and memCherry to visualize cytonemes and the Ror2, Ror23I or Ror2-MO oligomer. Confocal images of single cells were taken and subjected to filopodia length/number measurement. See Figure 4—figure supplement 1 for stacked diagrams with chi-squared test analysis. (F) Bar diagram showing the number of filopodia without Wnt8a-GFP (i.e. GFP signal below detection limit) or filopodia carrying Wnt8a-GFP (cytonemes) (i.e. GFP signal above detection limit) per cell. Statistical analysis ***=P<0.001, **=P<0.01, *P<0.05. Data meet the assumptions illustrated in (B) that filopodia length and number are significantly different at the analyzed time-points (One-way ANOVA, p=1.35*10−9, confidence interval 95%, F value=27.6, and df=73) and in (D) that the filopodia number and length are significantly different across treatments (p=1.61542*10−7, confidence interval 95%, F value=24.6, and df=39). (G) Simulation of Wnt dissemination in a growing tissue over 180 min. Wnt8a is distributed in a graded manner in the target tissue. Modeling the dynamically expanding tissue with single-cell resolution and discrete implementation of cytoneme-based transport establishes a morphogen gradient over the length of the developing tissue. On the basis of the cytoneme appearance measured in (D) and (F), Ror2 activity in the Wnt-producing cells alters the input of Wnt in the target field, which is directly incorporated into the simulation by altering the formation frequency of cytonemes and thus ligand concentration in the neighboring tissue. Simulated time in minutes after the onset of Wnt production at 4 hpf.