
Image
|
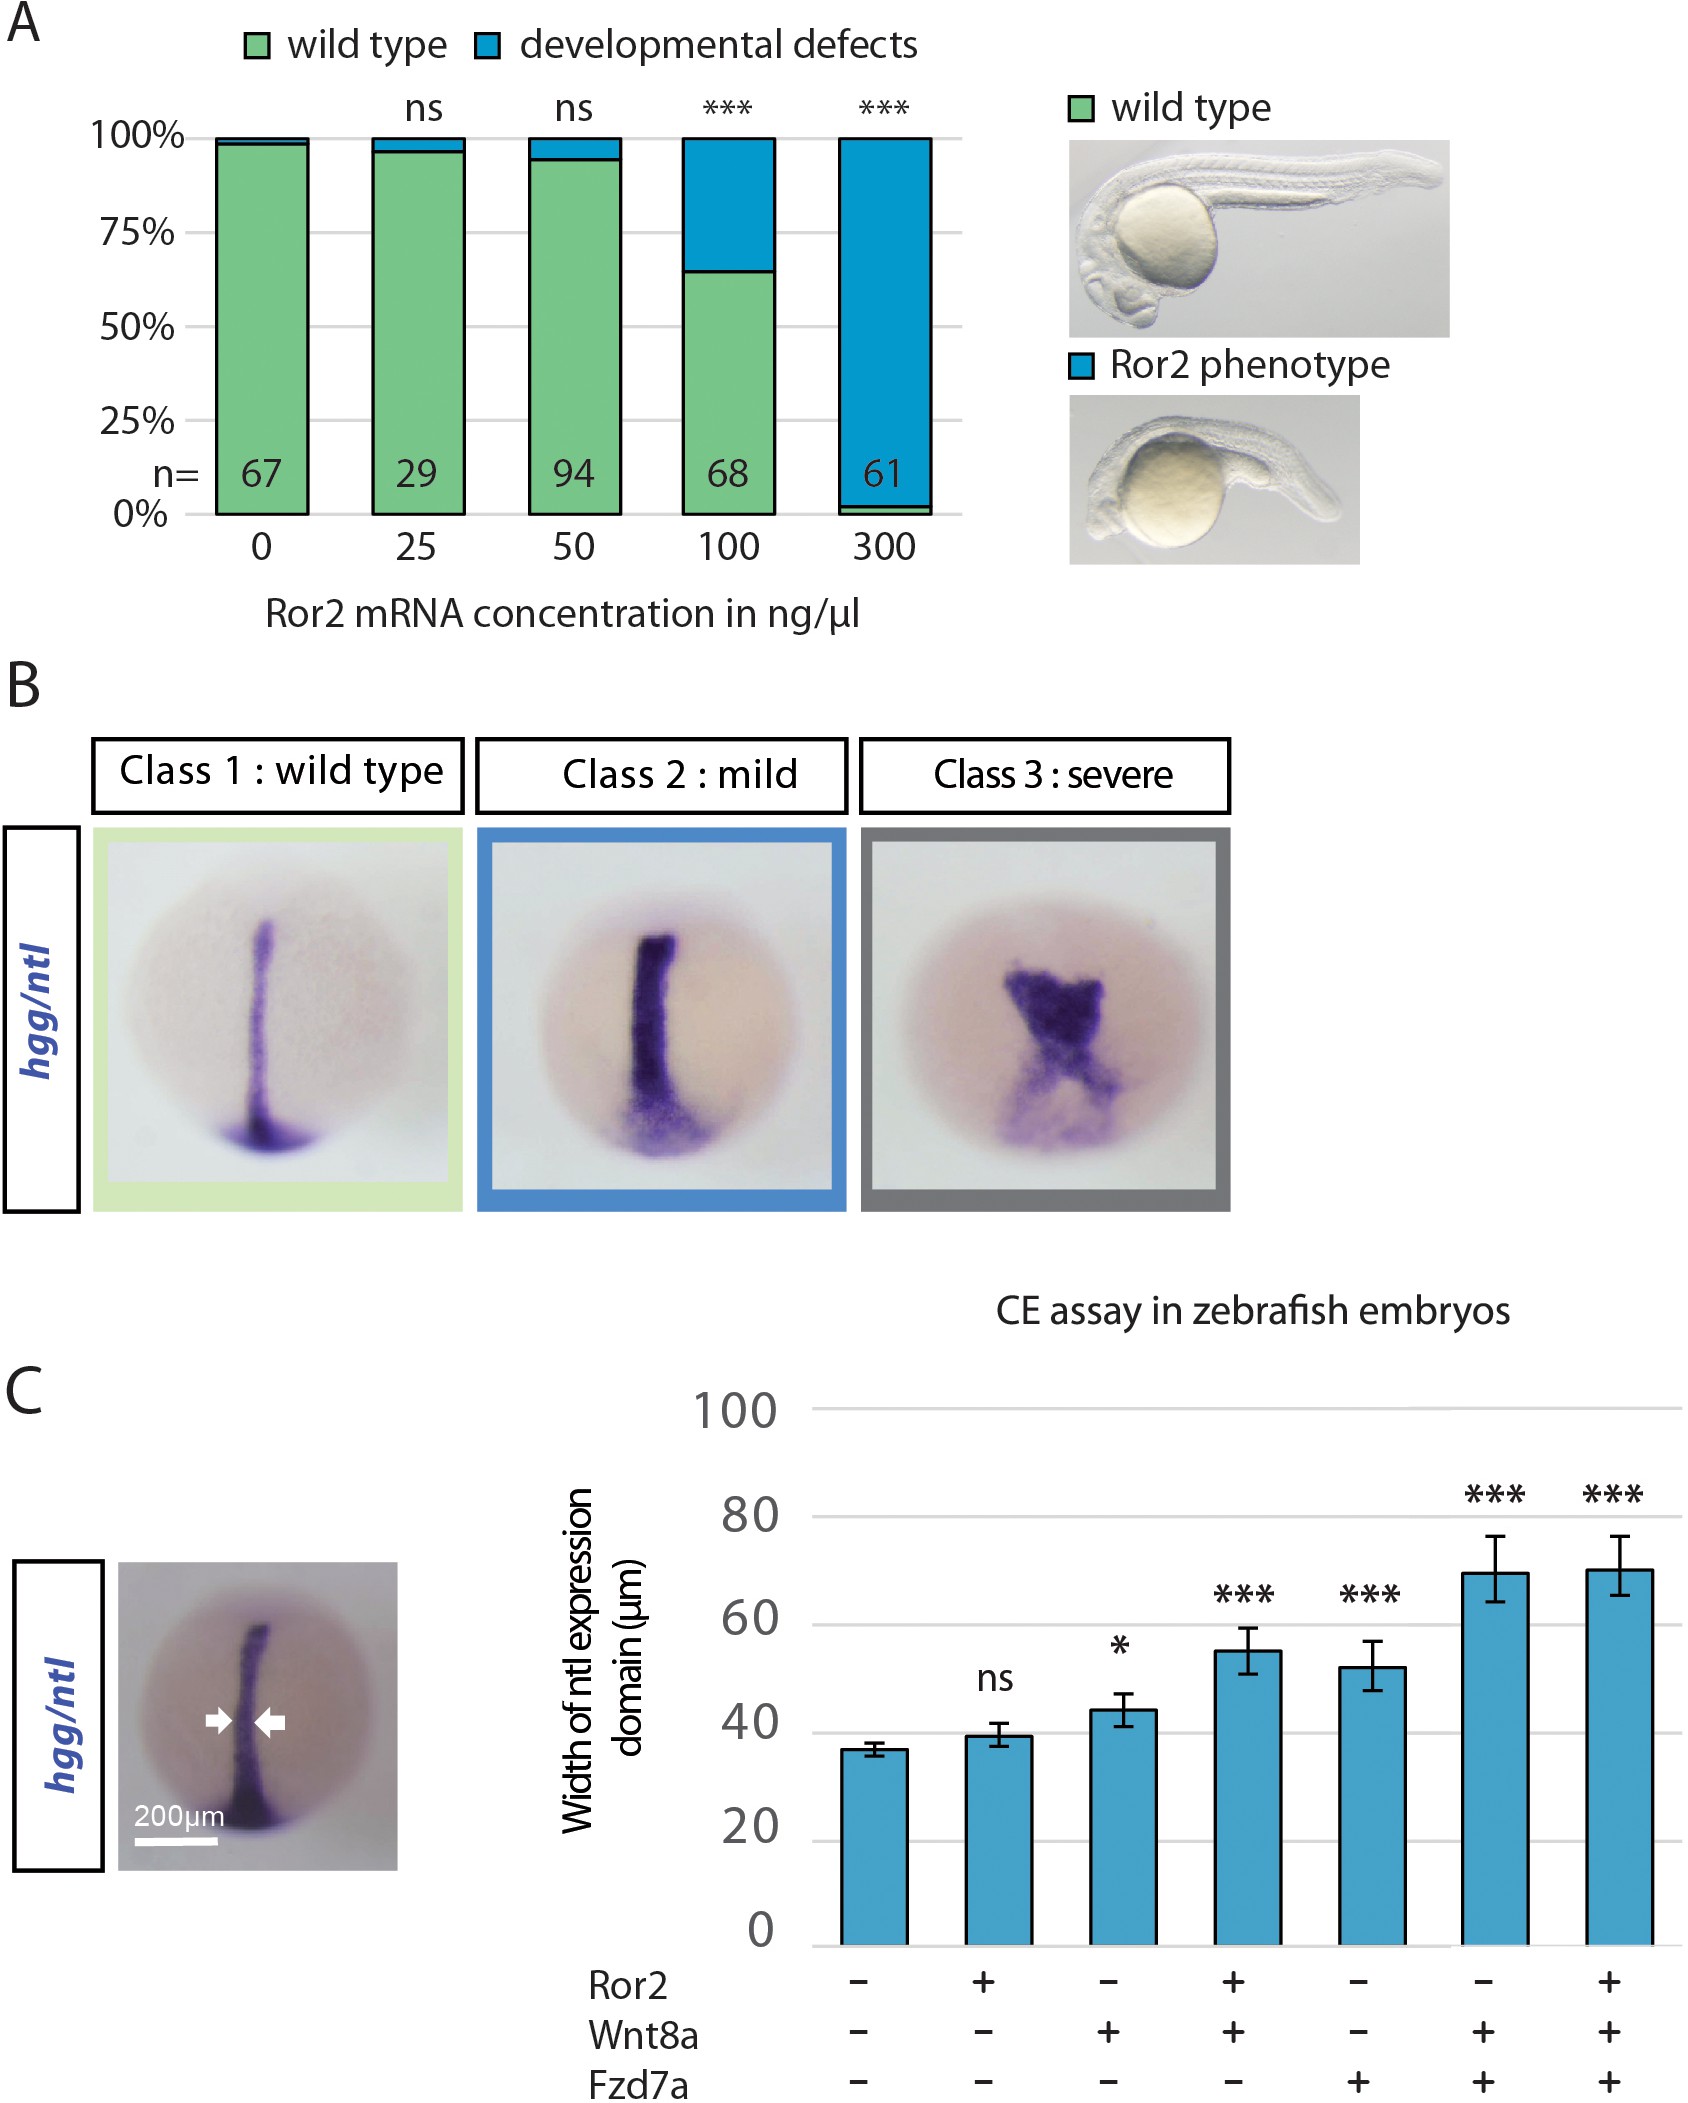
Figure Caption
Fig. 3-S1
Analysis of convergent extension phenotype in zebrafish development
(A) Microinjection of Ror2-mCherry mRNA in rising concentrations and classification of phenotypes into groups showing developmental alterations at 24 hpf. A Chi-squared test was performed to determine the p values. (B) Classification of embryos into three groups of phenotypes depending on their ntl expression. (C) Quantification of the ntl expression width. Location of the measurement is shown in the left image (dorsal view, animal to the top) and the bar diagram represents average width with SEM. ***=P<0.001, *=P<0.05.
Acknowledgments
This image is the copyrighted work of the attributed author or publisher, and
ZFIN has permission only to display this image to its users.
Additional permissions should be obtained from the applicable author or publisher of the image.
Full text @ Elife