
|
Fig. S1
Embryonic posterior axis defects strictly correlate with scospondin mutated alleles, related to Figure 1 and Table S1
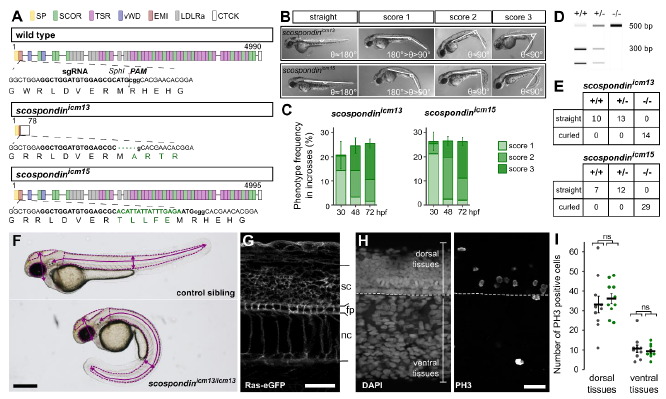
A. CRISPR/Cas9-mediated genome editing leading to a nonsense mutation, and a five amino acids insertion in the EMI domain of SCO-spondin for the scospondinicm13 and scospondinicm15 allele, respectively (SP: signal peptide, EMI: Emilin domain, SCOR: SCO-spondin repeats, vWD: von Willebrand D domain, LDLRa: Low-Density Lipoprotein Receptor type A Repeat, TSR: Thrombospondin type 1 Repeats, CTCK: C-terminal Cystine Knot, see [S1]). B. scospondin mutants show different levels of severity in body axis curvature at 48 hpf (score 1, 2, 3). Curvature defects are classified according to the angle (θ) between the tail and the rostral axis. C. Around 25% of embryos showed curvature defects from 30 hpf onwards, in agreement with Mendelian distributions. Curvature defects (%, mean ± SEM) were more pronounced over time for both scospondin alleles (from 30 to 72 hpf, n=386 and 248 embryos for icm13 and icm15 alleles respectively, n= 3 clutches). D. Embryos from scospondinicm13/+ and scospondinicm15/+ incrosses were genotyped at 72 hpf using the Sph1 restriction site loss in scospondin mutants. E. All scospondin homozygous mutants showed the curled-down phenotype and it was observed neither in the scospondin heterozygous nor in wild type embryos. The same is true for trans-heterozygous scospondinicm13/icm15 embryos (data not shown). F. To perform morphometric analysis of scospondin mutants, 48 hpf control and curled-down embryos from both alleles were measured for the eye, brain ventricles and tail area (dotted lines) as well as head and trunk height and tail length (solid lines). (Scale bar represents 1 mm.) G. To perform morphometric measurements at the level of the trunk, 30 hpf control and scospondinicm13/icm13 embryos injected at one cell stage with the Ras-eGFP mRNA were immunostained against GFP. The membrane-tag fluorescence was used to measure the spinal cord (sc), floor plate (fp) and notochord (nc) height in both straight and curled-down siblings. H. Representative images of a 30 hpf control embryo immunostained against phospho-histone 3 (PH3, right) allowing to detect cell proliferation. DAPI counterstaining of the nuclei (left) allowed differentiating dorsal and ventral tissues above and under the floorplate (dotted line) respectively. I. Quantification of PH3 positive cells in control (black) and scospondinicm13/icm13 (green) embryos at 30 hpf in dorsal and ventral tissues. n=10 embryos for each condition. p= 0.57; 0.55, t= -0.58; 0.61 and df= 15; 14 for dorsal; ventral tissues respectively; two-tailed t-test. Scale bars represent 30 μm in G and H.