
|
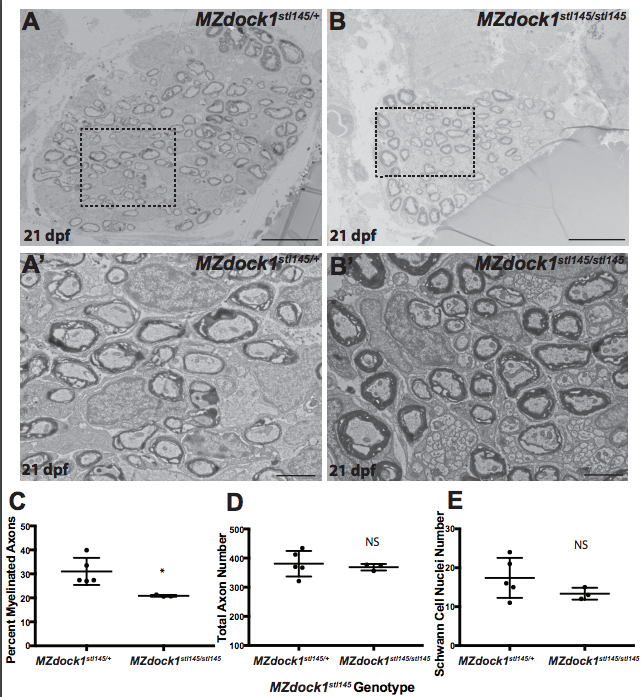
Fig. S4 A-B) TEM of a cross-section of the PLLn at 21 dpf in MZ siblings. Scale bars = 10 μm. (A’-B′) Magnified images. Scale bars = 2 μm. A-A’) Axons in MZdock1stl145 heterozygotes (n = 4 animals, 5 nerves) contain many myelinated axons and B-B′) MZdock1stl145 mutants have fewer myelinated axons (n = 2 animals, 3 nerves). C) Quantification of the percent myelinated axons. D) Quantification of the total number of axons (NS, p = 0.5831). E) Quantification of the total number of Schwann cell nuclei (NS, p = 0.1583). Bars represent means ± SD. *p < 0.05, unpaired t Test with Welch’s correction. (PDF 2275 kb)