
|
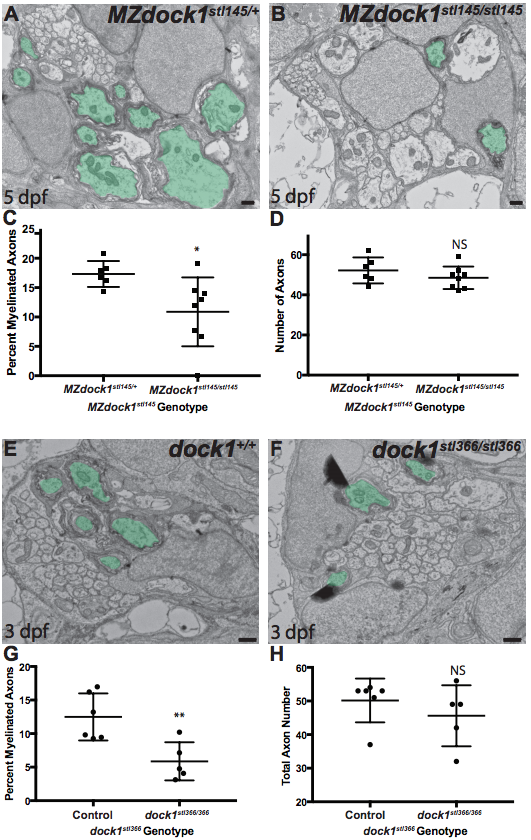
Fig. S3 A-B) TEM of a cross-section of the PLLn at 5 dpf in MZ siblings. Myelinated axons are pseudocolored in green. Scale bars = 500 nm. A) Axons in MZdock1stl145 heterozygotes (n = 4 animals, 6 nerves) contain many myelinated axons whereas B) MZdock1stl145 mutants have fewer myelinated axons (n = 5 animals, 8 nerves). C) Quantification of the percent myelinated axons. D) Quantification of the total number of axons (NS, p = 0.2926). E-F) TEM of a cross-section of the PLLn at 3 dpf in dock1stl366 siblings. Myelinated axons are pseudocolored in green. Scale bars = 500 nm. E) Schwann cells in control siblings have myelinated more axons (n = 4 animals, 6 nerves) compared to F) dock1stl366 homozygous mutant nerves (n = 3 animals, 5 nerves). G) Quantification of the percent myelinated axons. H) Quantification of the total number of axons (NS, p = 0.3775). Bars represent means ± SD. *p < 0.05, **p < 0.01, unpaired t Test with Welch’s correction. (PDF 1677 kb)