
|
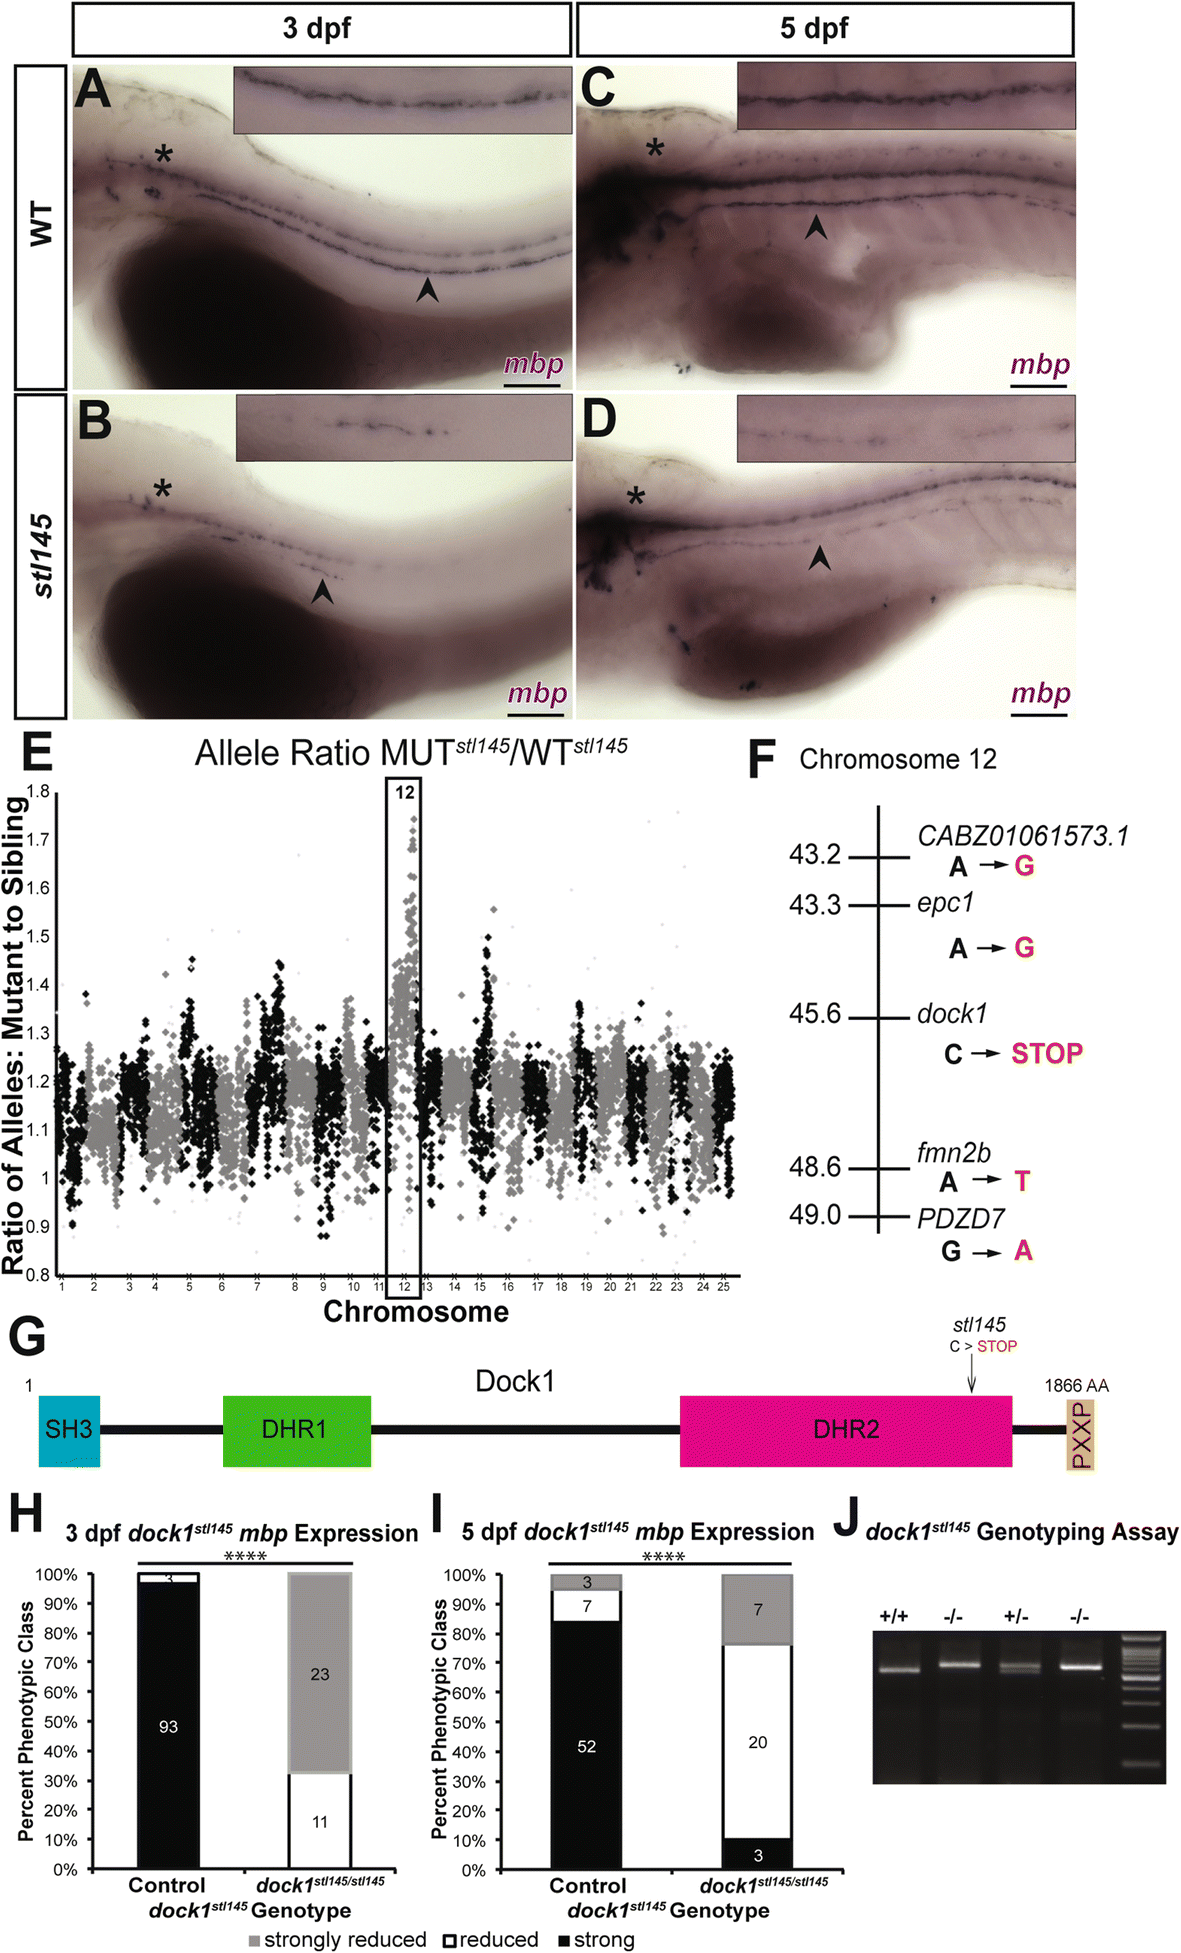
Fig. 1
stl145 mutants exhibit decreased mbp expression in the PNS. a-d) Lateral views of mbp expression by WISH. Arrowheads indicate the PLLn. Asterisks indicate the central nervous system (CNS). Inset panels show a magnified view of the PLLn. Scale bars = 100 μm. a) mbp at 3 dpf is strongly expressed in the PLLn of control larva (n = 93/96). b) stl145 mutants at 3dpf exhibit reduced mbp expression in the PLLn (n = 34). c) mbp expression is strongly expressed in the PLLn of control larva at 5 dpf (n = 52/62). d) stl145 mutants at 5 dpf express mbp, but at reduced levels compared to control siblings (n = 27/30). e) Analysis of whole genome sequencing data showed that chromosome 12 exhibited the highest mutant to wild-type allele ratio. f) Within the most highly linked region of chromosome 12, dock1 was the only gene that contained an early stop codon. g) A schematic of the protein structure of Dock1 and the location of the stl145 lesion. The SH3 and proline rich domains can bind adaptor proteins. The DHR-1 domain interacts with PtdIns(3,4,5)P3 and the DHR-2 domain is the catalytic domain can that catalyzes the exchange of GDP for GTP in Rac1. h-i) Quantification of WISH for mbp at 3 dpf (h) and 5 dpf (i), respectively, based on phenotypic classes and genotypes for the stl145 lesion. **** p < 0.0001, Chi-squared analysis. j) Genotyping assay for the stl145 lesion. The PCR amplified product is digested with BstN1 and run on a 3% agarose gel